Hyundai 2002 Annual Report Download - page 26
Download and view the complete annual report
Please find page 26 of the 2002 Hyundai annual report below. You can navigate through the pages in the report by either clicking on the pages listed below, or by using the keyword search tool below to find specific information within the annual report.-
 1
1 -
2
-
3
-
4
-
5
-
6
-
7
-
8
-
9
-
10
-
11
-
12
-
13
-
14
-
15
-
 16
16 -
 17
17 -
 18
18 -
 19
19 -
 20
20 -
 21
21 -
 22
22 -
 23
23 -
 24
24 -
 25
25 -
 26
26 -
 27
27 -
 28
28 -
 29
29 -
 30
30 -
 31
31 -
 32
32 -
 33
33 -
 34
34 -
 35
35 -
 36
36 -
37
-
38
-
39
-
40
-
41
-
42
-
43
-
44
-
45
-
46
 |
 |

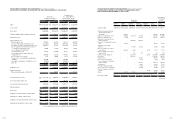
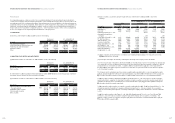
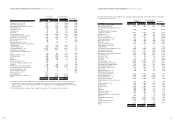
HYUNDAI MOTOR COMPANY AND SUBSIDIARIES: Financial Statements 2002
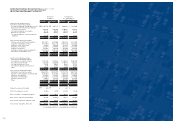
CONSOLIDATED STATEMENTS OF CHANGES IN SHAREHOLDERS’ EQUITY
FOR THE YEARS ENDED DECEMBER 31, 2002 and 2001
Korean won
(in millions)
Capital Capital Retained Capital Minority Total Total
stock surplus earnings adjustments interest amount amount
January 1, 2001 1,476,454 5,354,390 1,708,256 (795,174) 2,417,595 10,161,521 $ 8,465,112
Difference between additional
investment and equity of
subsidiaries - (74,984) - - - (74,984) (62,466)
Disposal of subsidiaries’ stock - (75,004) (62,139) 49,264 - (87,879) (73,208)
Disposal of treasury stock - 15,380 - 213,342 - 228,722 190,538
Retirement of treasury stock by
retained earnings - - (168,694) 168,694 - -
Retirement of subsidiaries’ treasury
stock - 68,732 - - - 68,732 57,258
Application of the equity
method - - (1,649) (2,252) - (3,901) (3,250)
Effect of change in the scope of
consolidation - (43,854) (486) - 48,151 3,811 3,175
Effect of change in the scope of
equity method - - (33) 477 - 444 370
Payment of cash dividends - - (165,387) - (2,297) (167,684) (139,690)
Net income - - 1,152,136 - - 1,152,136 959,793
Treasury stock - - - 40,369 - 40,369 33,630
Discount on stock issuance - - - (573) (573) (477)
Loss on valuation of investment
equity securities - - - 194,237 - 194,237 161,810
Stock options - - - 6,693 - 6,693 5,576
Cumulative translation debits - - 14,188 - 14,188 11,819
Loss on transaction of derivatives - - - 45,300 - 45,300 37,737
Effect of change in the minority
interest - - - - 49,388 49,388 41,143
Others - 61,672 11,936 - - 73,608 61,320
December 31, 2001 1,476,454 5,306,332 2,473,940 (65,435) 2,512,837 11,704,128 $9,750,190
(continued)
Translation into
U.S. dollars
(Note 2)
(in thousands)
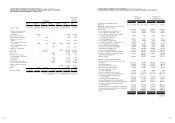
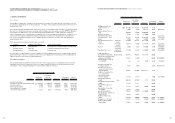
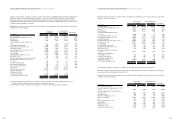
HYUNDAI MOTOR COMPANY AND SUBSIDIARIES: Financial Statements 2002
CONSOLIDATED STATEMENTS OF INCOME FOR THE YEARS ENDED DECEMBER 31, 2002 AND 2001
Korean won
(in millions, except per
share amounts)
2002 2001 2002 2001
Sales 48,122,919 39,851,575 $ 40,089,069 $ 33,198,580
Cost of sales 35,462,821 29,307,330 29,542,503 24,414,637
Gross profit 12,660,098 10,544,245 10,546,566 8,783,943
Selling and administrative expenses (Note 16) 9,529,256 7,426,130 7,938,401 6,186,380
Operating income 3,130,842 3,118,115 2,608,165 2,597,563
Other expenses, net:
Interest expense, net 210,619 562,326 175,457 468,449
Loss on foreign currency translations, net (132,258) 101,732 (110,178) 84,748
Loss (gain) on foreign currency transaction, net (209,587) 113,543 (174,598) 94,588
Loss on valuation of investments accounted
for using the equity method, net 70,065 27,599 58,368 22,991
Loss on disposal of investments
and other assets, net 63,971 219,694 53,291 183,017
Loss on disposal of property, plant and
equipment, net 206,424 83,472 171,963 69,537
Loss on valuation of inventory 5,331 30,603 4,441 25,494
Provision for accrued warranties and product
liabilities 291,708 - 243,009 -
Loss (gain) on redemption of debentures, net (37,022) 95 (30,841) 79
Other, net (81,206) 80,689 (67,650) 67,219
388,045 1,219,753 323,262 1,016,122
Ordinary income 2,742,797 1,898,362 2,284,903 1,581,441
Extraordinary items:
Other extraordinary gain, net (Note 17) - 190,650 - 158,822
Translation into
U. S. dollars (Note 2)
(in thousands, except
per share amounts)
50 51
Income before income tax 2,742,797 2,089,012 $ 2,284,903 $ 1,740,263
Income tax expense (Note 18) 844,344 671,164 703,386 559,117
Income before minority interests 1,898,453 1,417,848 1,581,517 1,181,146
Minority interests (464,058) (265,712) (386,586) (221,353)
Net income 1,434,395 1,152,136 $1,194,931 $959,793
Ordinary income per ordinary common share 6,313 5,713 $5.26 $4.76
Earnings per ordinary common share 6,313 5,103 $5.26 $4.25
Ordinary income per fully diluted common share 6,290 - $5.24 $-
Earnings per fully diluted common share 6,290 - $5.24 $-
See accompanying notes to consolidated financial statements