Hyundai 2002 Annual Report Download - page 25
Download and view the complete annual report
Please find page 25 of the 2002 Hyundai annual report below. You can navigate through the pages in the report by either clicking on the pages listed below, or by using the keyword search tool below to find specific information within the annual report.-
 1
1 -
2
-
3
-
4
-
5
-
6
-
7
-
8
-
9
-
10
-
11
-
12
-
13
-
14
-
 15
15 -
 16
16 -
 17
17 -
 18
18 -
 19
19 -
 20
20 -
 21
21 -
 22
22 -
 23
23 -
 24
24 -
 25
25 -
 26
26 -
 27
27 -
 28
28 -
 29
29 -
 30
30 -
 31
31 -
 32
32 -
 33
33 -
 34
34 -
 35
35 -
36
-
37
-
38
-
39
-
40
-
41
-
42
-
43
-
44
-
45
-
46
 |
 |
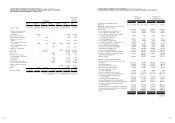
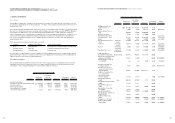
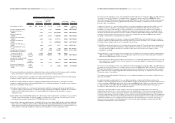
HYUNDAI MOTOR COMPANY AND SUBSIDIARIES: Financial Statements 2002
CONSOLIDATED BALANCE SHEETS (CONTINUED) AS OF DECEMBER 31, 2002 AND 2001
Korean won Translation into
(in millions) U. S. dollars (Note 2)
(in thousands)
LIABILITIES AND SHAREHOLDERS EQUITY 2002 2001 2002 2001
Current liabilities:
Short-term borrowings (Note 11) 7,526,948 6,748,184 $ 6,270,367 $ 5,621,613
Current maturities of long-term debt, net of
unamortized discount of 657 million in
2002 and 5,877 million in 2001 (Note 12) 3,049,849 2,768,331 2,540,694 2,306,174
Trade notes and accounts payable 4,695,480 3,775,059 3,911,596 3,144,834
Accrued warranties and product liabilities 901,254 725,040 750,795 603,999
Accounts payable-other 2,741,462 1,488,025 2,283,790 1,239,607
Accrued expenses 314,674 621,008 262,141 517,334
Income tax payable 585,447 415,405 487,710 346,055
Other current liabilities 1,016,682 1,116,014 846,952 929,702
Total current liabilities 20,831,796 17,657,066 17,354,045 14,709,318
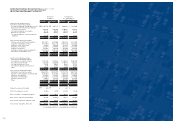
Long-term liabilities:
Long-term debt, net of current maturities
(Note 12) 8,010,263 8,259,094 6,672,995 6,880,285
Accrued severance benefits, net of National
Pension payments for employees of 123,960
million in 2002 and 141,674 million in
2001 and individual severance insurance
deposits of 1,513,268 million in 2002 and
1,250,037 million in 2001 (Note 2) 955,281 752,244 795,802 626,661
Accrued loss on valuation of derivatives
(Note 2) 17,053 62,382 14,206 51,968
Accrued warranties and product liabilities 2,401,220 1,171,058 2,000,350 975,556
Deferred income tax liabilities (Note 18) 124,295 84,891 103,545 70,719
Other long-term liabilities 334,966 181,433 279,045 151,144
Total long-term liabilities 11,843,078 10,511,102 9,865,943 8,756,333
Other financial business liabilities 12,732 - 10,607 -
Total liabilities 32,687,606 28,168,168 $ 27,230,595 $ 23,465,651
Commitments and contingencies (Note 22)
Shareholders’ equity:
Capital stock (Note 13) 1,476,454 1,476,454 $ 1,229,968 $ 1,229,968
Capital surplus 5,286,061 5,306,332 4,403,583 4,420,470
Retained earnings
(Net income of 1,434,395 million in 2002
and 1,152,136 million in 2001) 3,677,983 2,473,940 3,063,964 2,060,930
Capital adjustments (Note 14) (106,417) (65,435) (88,651) (54,511)
Minority interests 3,104,001 2,512,837 2,585,806 2,093,333
Total shareholders’ equity 13,438,082 11,704,128 11,194,670 9,750,190
Total liabilities
and shareholders’ equity 46,125,688 39,872,296 $38,425,265 $33,215,841
See accompanying notes to consolidated financial statements
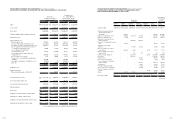
HYUNDAI MOTOR COMPANY AND SUBSIDIARIES: Financial Statements 2002
CONSOLIDATED BALANCE SHEETS AS OF DECEMBER 31, 2002 AND 2001
Korean won Translation into
(in millions) U. S. dollars (Note 2)
(in thousands)
ASSETS 2002 2001 2002 2001
Current assets:
Cash and cash equivalents (Note 15) 2,765,872 2,304,424 $ 2,304,125 $ 1,919,713
Short-term financial instruments (Note 15) 3,610,223 1,634,060 3,007,517 1,361,263
Marketable securities (Notes 4 and 15) 710,474 866,521 591,864 721,860
Trade notes and accounts receivable, less
allowance for doubtful accounts of 289,549
million in 2002 and 297,372 million in 2001
and unamortized discount of 2,820 million
in 2002 and 4,215 million in 2001 2,198,905 1,848,372 1,831,810 1,539,797
Inventories (Note 3) 3,819,999 3,787,927 3,182,272 3,155,554
Advances and other, net of allowance for
doubtful accounts of 165,122 million in 2002
and 210,420 million in 2001 and unamortized
discount of 9,639 million in 2002 and
14,540 million in 2001 2,005,079 1,597,411 1,670,343 1,330,732
Total current assets 15,110,552 12,038,715 12,587,931 10,028,919
Non-current assets:
Long-term financial instruments (Note 15) 102,195 99,735 85,134 83,085
Investment, net of unamortized discount of
23,341 million in 2002 and 25,545 million
in 2001 (Notes 4 and 15) 2,061,273 1,743,242 1,717,155 1,452,218
Property, plant and equipment, net of
accumulated depreciation of 6,415,241
million in 2002 and 5,317,325 million in
2001 (Notes 5, 6, 7 and 15) 16,745,238 16,905,497 13,949,715 14,083,220
Intangibles (Note 8) 1,678,110 2,151,235 1,397,959 1,792,098
Other assets (Note 9) 693,842 731,407 578,009 609,303
Deferred income tax assets (Note 18) 1,366,637 1,134,052 1,138,485 944,728
Total non-current assets 22,647,295 22,765,168 18,866,457 18,964,652
Other financial business assets (Note 10) 8,367,841 5,068,413 6,970,877 4,222,270
Total assets 46,125,688 39,872,296 $38,425,265 $33,215,841
(continued)
48 49