Freddie Mac 2010 Annual Report Download - page 9
Download and view the complete annual report
Please find page 9 of the 2010 Freddie Mac annual report below. You can navigate through the pages in the report by either clicking on the pages listed below, or by using the keyword search tool below to find specific information within the annual report.-
 1
1 -
 2
2 -
 3
3 -
 4
4 -
 5
5 -
 6
6 -
 7
7 -
 8
8 -
 9
9 -
 10
10 -
 11
11 -
 12
12 -
 13
13 -
 14
14 -
 15
15 -
 16
16 -
 17
17 -
 18
18 -
 19
19 -
 20
20 -
21
-
22
-
23
-
24
-
25
-
26
-
27
-
28
-
29
-
30
-
31
-
32
-
33
-
34
-
35
-
36
-
37
-
38
-
39
-
40
-
41
-
42
-
43
-
44
-
45
-
46
-
47
-
48
-
49
-
50
-
51
-
52
-
53
-
54
-
55
-
56
-
57
-
58
-
59
-
60
-
61
-
62
-
63
-
64
-
65
-
66
-
67
-
68
-
69
-
70
-
71
-
72
-
73
-
74
-
75
-
76
-
77
-
78
-
79
-
80
-
81
-
82
-
83
-
84
-
85
-
86
-
87
-
88
-
89
-
90
-
91
-
92
-
93
-
94
-
95
-
96
-
97
-
98
-
99
-
100
-
101
-
102
-
103
-
104
-
105
-
106
-
107
-
108
-
109
-
110
-
111
-
112
-
113
-
114
-
115
-
116
-
117
-
118
-
119
-
120
-
121
-
122
-
123
-
124
-
125
-
126
-
127
-
128
-
129
-
130
-
131
-
132
-
133
-
134
-
135
-
136
-
137
-
138
-
139
-
140
-
141
-
142
-
143
-
144
-
145
-
146
-
147
-
148
-
149
-
150
-
151
-
152
-
153
-
154
-
155
-
156
-
157
-
158
-
159
-
160
-
161
-
162
-
163
-
164
-
165
-
166
-
167
-
168
-
169
-
170
-
171
-
172
-
173
-
174
-
175
-
176
-
177
-
178
-
179
-
180
-
181
-
182
-
183
-
184
-
185
-
186
-
187
-
188
-
189
-
190
-
191
-
192
-
193
-
194
-
195
-
196
-
197
-
198
-
199
-
200
-
201
-
202
-
203
-
204
-
205
-
206
-
207
-
208
-
209
-
210
-
211
-
212
-
213
-
214
-
215
-
216
-
217
-
218
-
219
-
220
-
221
-
222
-
223
-
224
-
225
-
226
-
227
-
228
-
229
-
230
-
231
-
232
-
233
-
234
-
235
-
236
-
237
-
238
-
239
-
240
-
241
-
242
-
243
-
244
-
245
-
246
-
247
-
248
-
249
-
250
-
251
-
252
-
253
-
254
-
255
-
256
-
257
-
258
-
259
-
260
-
261
-
262
-
263
-
264
-
265
-
266
-
267
-
268
-
269
-
270
-
271
-
272
-
273
-
274
-
275
-
276
-
277
-
278
-
279
-
280
-
281
-
282
-
283
-
284
-
285
-
286
-
287
-
288
-
289
-
290
-
291
-
292
-
293
-
294
-
295
-
296
-
297
-
298
-
299
-
300
-
301
-
302
-
303
-
304
-
305
-
306
-
307
-
308
-
309
-
310
-
311
-
312
-
313
-
314
-
315
-
316
-
317
-
318
-
319
-
320
-
321
-
322
-
323
-
324
-
325
-
326
-
327
-
328
-
329
-
330
-
331
-
332
-
333
-
334
-
335
-
336
-
337
-
338
-
339
-
340
-
341
-
342
-
343
-
344
-
345
-
346
-
347
-
348
-
349
-
350
-
351
-
352
-
353
-
354
-
355
-
356
 |
 |

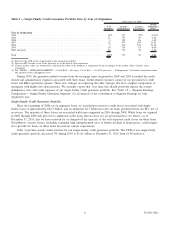
Table 2 — Single-Family Credit Guarantee Portfolio Data by Year of Origination
%of
Portfolio
(1)
Average
Credit Score
(2)
Current
LTV Ratio
(3)
Serious
Delinquency
Rate
(4)
At December 31, 2010
Year of Origination
2010 . . . . . . . . . ................................................. 18% 755 70% 0.05%
2009 . . . . . . . . . ................................................. 21 755 70 0.26
2008 . . . . . . . . . ................................................. 9 728 86 4.89
2007 . . . . . . . . . ................................................. 11 707 104 11.63
2006 . . . . . . . . . ................................................. 9 712 104 10.46
2005 . . . . . . . . . ................................................. 10 719 91 6.04
2004 and prior . . ................................................. 22 722 58 2.46
Total . . . . . . . . . ................................................. 100% 733 78 3.84
(1) Based on the UPB of the single-family credit guarantee portfolio.
(2) Based on FICO credit score of the borrower as of the date of loan origination.
(3) Current market values are estimated by adjusting the value of the property at origination based on changes in the market value of homes since
origination.
(4) See “MD&A — RISK MANAGEMENT — Credit Risk — Mortgage Credit Risk — Credit Performance — Delinquencies” for further information about
our reported serious delinquency rates.
During 2010, the guarantee-related revenue from the mortgage loans originated in 2009 and 2010 exceeded the credit-
related and administrative expenses associated with these loans. Credit-related expenses consist of our provision for credit
losses and REO operations expense. These new vintages are replacing the older vintages that have a higher composition of
mortgages with higher-risk characteristics. We currently expect that, over time, this should positively impact the serious
delinquency rates and credit expenses of our single-family credit guarantee portfolio. See “Table 19 — Segment Earnings
Composition — Single-Family Guarantee Segment” for an analysis of the contribution to Segment Earnings by loan
origination year.
Single-Family Credit Guarantee Portfolio
Since the beginning of 2008, on an aggregate basis, we recorded provision for credit losses associated with single-
family loans of approximately $62.3 billion, and an additional $4.7 billion in losses on loans purchased from our PCs, net of
recoveries. The majority of these losses are associated with loans originated in 2005 through 2008. While loans we acquired
in 2005 through 2008 will give rise to additional credit losses that we have not yet provisioned for, we believe, as of
December 31, 2010, that we have reserved for or charged-off the majority of the total expected credit losses for these loans.
Nevertheless, various factors, including continued high unemployment rates or further declines in home prices, could require
us to provide for losses on these loans beyond our current expectations.
Table 3 provides certain credit statistics for our single-family credit guarantee portfolio. The UPB of our single-family
credit guarantee portfolio decreased 5% during 2010 to $1.81 trillion at December 31, 2010 from $1.90 trillion at
6Freddie Mac