Freddie Mac 2010 Annual Report Download - page 6
Download and view the complete annual report
Please find page 6 of the 2010 Freddie Mac annual report below. You can navigate through the pages in the report by either clicking on the pages listed below, or by using the keyword search tool below to find specific information within the annual report.-
 1
1 -
 2
2 -
 3
3 -
 4
4 -
 5
5 -
 6
6 -
 7
7 -
 8
8 -
 9
9 -
 10
10 -
 11
11 -
 12
12 -
 13
13 -
 14
14 -
 15
15 -
 16
16 -
 17
17 -
18
-
19
-
20
-
21
-
22
-
23
-
24
-
25
-
26
-
27
-
28
-
29
-
30
-
31
-
32
-
33
-
34
-
35
-
36
-
37
-
38
-
39
-
40
-
41
-
42
-
43
-
44
-
45
-
46
-
47
-
48
-
49
-
50
-
51
-
52
-
53
-
54
-
55
-
56
-
57
-
58
-
59
-
60
-
61
-
62
-
63
-
64
-
65
-
66
-
67
-
68
-
69
-
70
-
71
-
72
-
73
-
74
-
75
-
76
-
77
-
78
-
79
-
80
-
81
-
82
-
83
-
84
-
85
-
86
-
87
-
88
-
89
-
90
-
91
-
92
-
93
-
94
-
95
-
96
-
97
-
98
-
99
-
100
-
101
-
102
-
103
-
104
-
105
-
106
-
107
-
108
-
109
-
110
-
111
-
112
-
113
-
114
-
115
-
116
-
117
-
118
-
119
-
120
-
121
-
122
-
123
-
124
-
125
-
126
-
127
-
128
-
129
-
130
-
131
-
132
-
133
-
134
-
135
-
136
-
137
-
138
-
139
-
140
-
141
-
142
-
143
-
144
-
145
-
146
-
147
-
148
-
149
-
150
-
151
-
152
-
153
-
154
-
155
-
156
-
157
-
158
-
159
-
160
-
161
-
162
-
163
-
164
-
165
-
166
-
167
-
168
-
169
-
170
-
171
-
172
-
173
-
174
-
175
-
176
-
177
-
178
-
179
-
180
-
181
-
182
-
183
-
184
-
185
-
186
-
187
-
188
-
189
-
190
-
191
-
192
-
193
-
194
-
195
-
196
-
197
-
198
-
199
-
200
-
201
-
202
-
203
-
204
-
205
-
206
-
207
-
208
-
209
-
210
-
211
-
212
-
213
-
214
-
215
-
216
-
217
-
218
-
219
-
220
-
221
-
222
-
223
-
224
-
225
-
226
-
227
-
228
-
229
-
230
-
231
-
232
-
233
-
234
-
235
-
236
-
237
-
238
-
239
-
240
-
241
-
242
-
243
-
244
-
245
-
246
-
247
-
248
-
249
-
250
-
251
-
252
-
253
-
254
-
255
-
256
-
257
-
258
-
259
-
260
-
261
-
262
-
263
-
264
-
265
-
266
-
267
-
268
-
269
-
270
-
271
-
272
-
273
-
274
-
275
-
276
-
277
-
278
-
279
-
280
-
281
-
282
-
283
-
284
-
285
-
286
-
287
-
288
-
289
-
290
-
291
-
292
-
293
-
294
-
295
-
296
-
297
-
298
-
299
-
300
-
301
-
302
-
303
-
304
-
305
-
306
-
307
-
308
-
309
-
310
-
311
-
312
-
313
-
314
-
315
-
316
-
317
-
318
-
319
-
320
-
321
-
322
-
323
-
324
-
325
-
326
-
327
-
328
-
329
-
330
-
331
-
332
-
333
-
334
-
335
-
336
-
337
-
338
-
339
-
340
-
341
-
342
-
343
-
344
-
345
-
346
-
347
-
348
-
349
-
350
-
351
-
352
-
353
-
354
-
355
-
356
 |
 |

During 2010, we paid cash dividends to Treasury of $5.7 billion on our senior preferred stock. We received cash
proceeds of $12.5 billion from draws under Treasury’s funding commitment during 2010. These draws were driven in large
part by changes in accounting principles adopted on January 1, 2010, which resulted in a net decrease to total equity (deficit)
of $11.7 billion. As a result of these draws from Treasury under the Purchase Agreement during 2010, the aggregate
liquidation preference of Treasury’s senior preferred stock increased to $64.2 billion at December 31, 2010. See “ —
Changes in Accounting Standards Related to Accounting for Transfers of Financial Assets and Consolidation of VIEs” for
additional information related to our changes in accounting principles.
Our Primary Business Objectives
Under conservatorship, we are focused on: (a) meeting the needs of the U.S. residential mortgage market by making
home ownership and rental housing more affordable by providing liquidity to mortgage originators and, indirectly, to
mortgage borrowers; (b) working to reduce the number of foreclosures and helping to keep families in their homes, including
through our role in the MHA Program initiatives, including HAMP, and our relief refinance mortgage initiative;
(c) minimizing our credit losses; and (d) maintaining the credit quality of the loans we purchase and guarantee. These
objectives reflect, in part, direction we have received from the Conservator. We also have a variety of different, and
potentially competing, objectives based on our charter, public statements from Treasury and FHFA officials, and other
guidance from our Conservator. For more information, see “Conservatorship and Related Developments — Impact of
Conservatorship and Related Actions on Our Business.”
Providing Mortgage Liquidity and Conforming Loan Availability
We provide liquidity and support to the U.S. mortgage market in a number of important ways:
• Our support enables borrowers to have access to a variety of conforming mortgage products, including the prepayable
30-year fixed-rate mortgage which represents the foundation of the mortgage market.
• Our support provides lenders with a constant source of liquidity. We estimate that we, Fannie Mae, and Ginnie Mae
collectively guaranteed approximately 89% of the single-family conforming mortgages originated during 2010.
• Our consistent market presence provides assurance to our customers that there will be a buyer for their conforming
loans that meet our credit standards. We believe this provides market stability in difficult environments.
• We are an important counter-cyclical influence as we stay in the market even when other sources of capital have
pulled out, as evidenced by the events of the last three years.
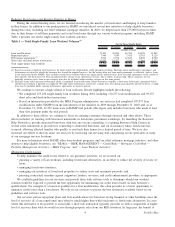
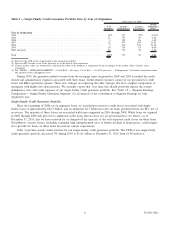
During 2010, we guaranteed $384.6 billion in UPB of single-family conforming mortgage loans representing 1.8 million
families who purchased homes or refinanced their mortgages. Relief refinance mortgages with LTV ratios of 80% and above
represented approximately 12% of our total single-family credit guarantee portfolio purchases in 2010. These mortgages
comprised approximately 4% of our total single-family credit guarantee portfolio at December 31, 2010.
Borrowers typically pay a lower interest rate on loans acquired or guaranteed by Freddie Mac, Fannie Mae, or Ginnie
Mae. Mortgage originators are generally able to offer homebuyers lower mortgage rates on conforming loan products,
including ours, in part because of the value investors place on GSE-guaranteed mortgage-related securities. Prior to 2007,
mortgage markets were less volatile, home values were stable or rising, and there were many sources of mortgage funds. We
estimate that prior to 2007 the average effective interest rates on conforming single-family mortgage loans were about
30 basis points lower than on non-conforming loans. Since 2007, there have been fewer sources of mortgage funds, and we
estimate that interest rates on conforming loans, excluding conforming jumbo loans, have been lower than those on non-
conforming loans by as much as 184 basis points. In December 2010, we estimate that borrowers were paying an average of
68 basis points less on these conforming loans than on non-conforming loans. These estimates are based on data provided by
HSH Associates, a third-party provider of mortgage market data.
3Freddie Mac