Freddie Mac 2010 Annual Report Download - page 8
Download and view the complete annual report
Please find page 8 of the 2010 Freddie Mac annual report below. You can navigate through the pages in the report by either clicking on the pages listed below, or by using the keyword search tool below to find specific information within the annual report.-
 1
1 -
 2
2 -
 3
3 -
 4
4 -
 5
5 -
 6
6 -
 7
7 -
 8
8 -
 9
9 -
 10
10 -
 11
11 -
 12
12 -
 13
13 -
 14
14 -
 15
15 -
 16
16 -
 17
17 -
 18
18 -
 19
19 -
20
-
21
-
22
-
23
-
24
-
25
-
26
-
27
-
28
-
29
-
30
-
31
-
32
-
33
-
34
-
35
-
36
-
37
-
38
-
39
-
40
-
41
-
42
-
43
-
44
-
45
-
46
-
47
-
48
-
49
-
50
-
51
-
52
-
53
-
54
-
55
-
56
-
57
-
58
-
59
-
60
-
61
-
62
-
63
-
64
-
65
-
66
-
67
-
68
-
69
-
70
-
71
-
72
-
73
-
74
-
75
-
76
-
77
-
78
-
79
-
80
-
81
-
82
-
83
-
84
-
85
-
86
-
87
-
88
-
89
-
90
-
91
-
92
-
93
-
94
-
95
-
96
-
97
-
98
-
99
-
100
-
101
-
102
-
103
-
104
-
105
-
106
-
107
-
108
-
109
-
110
-
111
-
112
-
113
-
114
-
115
-
116
-
117
-
118
-
119
-
120
-
121
-
122
-
123
-
124
-
125
-
126
-
127
-
128
-
129
-
130
-
131
-
132
-
133
-
134
-
135
-
136
-
137
-
138
-
139
-
140
-
141
-
142
-
143
-
144
-
145
-
146
-
147
-
148
-
149
-
150
-
151
-
152
-
153
-
154
-
155
-
156
-
157
-
158
-
159
-
160
-
161
-
162
-
163
-
164
-
165
-
166
-
167
-
168
-
169
-
170
-
171
-
172
-
173
-
174
-
175
-
176
-
177
-
178
-
179
-
180
-
181
-
182
-
183
-
184
-
185
-
186
-
187
-
188
-
189
-
190
-
191
-
192
-
193
-
194
-
195
-
196
-
197
-
198
-
199
-
200
-
201
-
202
-
203
-
204
-
205
-
206
-
207
-
208
-
209
-
210
-
211
-
212
-
213
-
214
-
215
-
216
-
217
-
218
-
219
-
220
-
221
-
222
-
223
-
224
-
225
-
226
-
227
-
228
-
229
-
230
-
231
-
232
-
233
-
234
-
235
-
236
-
237
-
238
-
239
-
240
-
241
-
242
-
243
-
244
-
245
-
246
-
247
-
248
-
249
-
250
-
251
-
252
-
253
-
254
-
255
-
256
-
257
-
258
-
259
-
260
-
261
-
262
-
263
-
264
-
265
-
266
-
267
-
268
-
269
-
270
-
271
-
272
-
273
-
274
-
275
-
276
-
277
-
278
-
279
-
280
-
281
-
282
-
283
-
284
-
285
-
286
-
287
-
288
-
289
-
290
-
291
-
292
-
293
-
294
-
295
-
296
-
297
-
298
-
299
-
300
-
301
-
302
-
303
-
304
-
305
-
306
-
307
-
308
-
309
-
310
-
311
-
312
-
313
-
314
-
315
-
316
-
317
-
318
-
319
-
320
-
321
-
322
-
323
-
324
-
325
-
326
-
327
-
328
-
329
-
330
-
331
-
332
-
333
-
334
-
335
-
336
-
337
-
338
-
339
-
340
-
341
-
342
-
343
-
344
-
345
-
346
-
347
-
348
-
349
-
350
-
351
-
352
-
353
-
354
-
355
-
356
 |
 |

short sales arises from the avoidance of costs we would otherwise incur to complete the foreclosure and dispose of the
property, including maintenance and other property expenses associated with holding REO property, legal fees, commissions,
and other selling expenses of traditional real estate transactions. The foreclosure process is a lengthy one in many
jurisdictions with significant associated costs to complete, including, in times of home value decline, foregone recovery we
might receive from an earlier sale. The nationwide average for completion of a foreclosure (as measured from the date of the
last scheduled payment made by the borrower) on our single-family delinquent loans, excluding those underlying our Other
Guarantee Transactions, was 448 days for the foreclosures we completed during 2010 and varied widely among jurisdictions.
We expect that the growth in short sales will continue, in part due to our recent initiatives, including offering incentives to
servicers to complete short sales instead of foreclosures as well as our implementation of HAFA.
We have contractual arrangements with our seller/servicers under which they agree to provide us with mortgage loans
that have been originated under specified underwriting standards. If we subsequently discover that contractual standards were
not followed, we can exercise certain contractual remedies to mitigate our credit losses. These contractual remedies include
the ability to require the seller/servicer to repurchase the loan at its current UPB or make us whole for any credit losses
realized with respect to the loan. As of December 31, 2010, the UPB of loans subject to repurchase requests issued to our
single-family seller/servicers was approximately $3.8 billion, and approximately 34% of these requests were outstanding for
more than four months since issuance of our repurchase request. The actual amount we expect to collect on these requests is
significantly less than their UPB amounts primarily because many of these requests are satisfied by reimbursement of our
realized losses by seller/servicers, or may be rescinded in the course of the contractual appeals process. During 2010 and
2009, we entered into agreements with certain seller/servicers to release certain loans in their portfolio from repurchase
obligations in exchange for one-time cash payments. We may enter into similar agreements or seek other remedies in the
future. See “MD&A — RISK MANAGEMENT — Credit Risk — Institutional Credit Risk — Mortgage Seller/Servicers” for
further information on our agreements with our seller/servicers.
Historically, our credit loss exposure has also been partially mitigated by mortgage insurance, which is a form of credit
enhancement. Primary mortgage insurance is required to be purchased, at the borrower’s expense, for certain mortgages with
higher LTV ratios. We received payments under primary and other mortgage insurance of $1.8 billion and $952 million in
the years ended December 31, 2010 and 2009, respectively, to help mitigate our credit losses.
Maintaining the Credit Quality of New Loan Purchases and Guarantees
We continue to focus on maintaining underwriting standards that allow us to purchase and guarantee loans made to
qualified borrowers that we believe will provide management and guarantee fee income, over the long-term, that exceeds our
anticipated credit-related and administrative expenses on the underlying loans.
As of December 31, 2010, more than one-third of our single-family credit guarantee portfolio consisted of mortgage
loans originated in 2009 and 2010. The substantial majority of the single-family mortgages we purchased in 2010 were
30-year and 15-year fixed-rate mortgages. We believe the credit quality of the single-family loans we acquired in 2009 and
2010 (excluding relief refinance mortgages) is better than that of loans we acquired from 2005 through 2008 as measured by
original LTV ratios, FICO scores, and income documentation standards. These newer loans have also experienced
significantly better serious delinquency trends at this stage in their lifecycle than loans acquired from 2006 through 2008.
Early serious delinquency performance and home price declines have historically been indicators of long-term credit
performance.
We believe the improvement in credit quality we are experiencing is primarily the result of the combination of:
(a) changes in our underwriting guidelines implemented during 2009 and 2010; (b) fewer purchases in 2009 and 2010 of
loans with higher-risk characteristics; (c) changes in mortgage insurers’ and lenders’ underwriting practices; and (d) an
increase in the relative amount of refinance mortgages versus new purchase mortgages we acquired in 2009 and 2010.
Approximately 80% of our purchases for the single-family credit guarantee portfolio in both 2010 and 2009 were refinance
mortgages. Refinance mortgages typically lower the borrower’s monthly mortgage payment, and thereby reduce the risk that
the borrower will default.
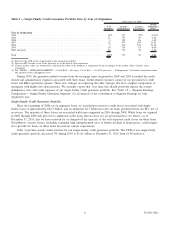
Table 2 presents the composition, loan characteristics, and serious delinquency rates of loans in our single-family credit
guarantee portfolio, by year of origination at December 31, 2010.
5Freddie Mac