Freddie Mac 2010 Annual Report Download - page 11
Download and view the complete annual report
Please find page 11 of the 2010 Freddie Mac annual report below. You can navigate through the pages in the report by either clicking on the pages listed below, or by using the keyword search tool below to find specific information within the annual report.• The impact of certain loan groups within the single-family credit guarantee portfolio, such as those underwritten with
certain lower documentation standards and interest-only loans, as well as other 2005 through 2008 vintage loans.
These groups continue to be large contributors to our credit losses.
• Continued declines in home prices in many geographic areas, based on our own index, which resulted in continued
high loss severity ratios on our dispositions of REO inventory.
Some of our loss mitigation activities create fluctuations in our delinquency statistics. For example, loans that we report
as seriously delinquent before they enter the HAMP trial period continue to be reported as seriously delinquent until the
modifications become effective and the loans are removed from delinquent status by our servicers. See “MD&A — RISK
MANAGEMENT — Credit Risk — Mortgage Credit Risk — Credit Performance — Delinquencies” for further information
about factors affecting our reported delinquency rates during 2010 and 2009.
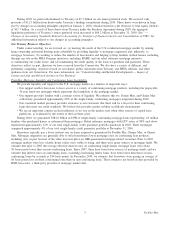
Government Support for our Business
We are dependent upon the continued support of Treasury and FHFA in order to continue operating our business. Our
ability to access funds from Treasury under the Purchase Agreement is critical to keeping us solvent and avoiding the
appointment of a receiver by FHFA under statutory mandatory receivership provisions. While the conservatorship has
benefited us, we are subject to certain constraints on our business activities imposed by Treasury due to the terms of, and
Treasury’s rights under, the Purchase Agreement and by FHFA, as our Conservator.
Under the Purchase Agreement, Treasury made a commitment to provide funding, under certain conditions, to eliminate
deficits in our net worth. The $200 billion cap on the funding commitment from Treasury will increase as necessary to
eliminate any net worth deficits during 2010, 2011, and 2012. We believe that the support provided by Treasury pursuant to
the Purchase Agreement currently enables us to maintain our access to the debt markets and to have adequate liquidity to
conduct our normal business activities, although the costs of our debt funding could vary.
On December 30, 2010, we received $100 million in funding from Treasury under the Purchase Agreement relating to
our net worth deficit as of September 30, 2010. The draws received during 2010 increased the aggregate liquidation
preference of the senior preferred stock to $64.2 billion at December 31, 2010 from $51.7 billion at December 31, 2009. To
address our net worth deficit of $401 million as of December 31, 2010, FHFA, as Conservator, will submit a draw request,
on our behalf, to Treasury under the Purchase Agreement in the amount of $500 million. Upon funding of the draw request:
(a) our aggregate funding received from Treasury under the Purchase Agreement will increase to $63.7 billion; and (b) the
aggregate liquidation preference on the senior preferred stock owned by Treasury will increase from $64.2 billion to
$64.7 billion and the corresponding annual cash dividend owed to Treasury will increase to $6.47 billion. We have paid cash
dividends to Treasury of $10.0 billion to date, an amount equal to 16% of our aggregate draws under the Purchase
Agreement. As of December 31, 2010, our annual cash dividend obligation to Treasury on the senior preferred stock
exceeded our annual historical earnings in all but one period. As a result, we expect to make additional draws in future
periods.
Neither the U.S. government nor any other agency or instrumentality of the U.S. government is obligated to fund our
mortgage purchase or financing activities or to guarantee our securities or other obligations.
For more information on the Purchase Agreement, see “Conservatorship and Related Matters.”
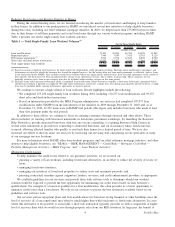
Long-Term Financial Sustainability and Future Status
It is unlikely that we will generate net income or comprehensive income in excess of our annual dividends payable to
Treasury over the long term, although we may experience period-to-period variability in earnings and comprehensive income.
As a result, there is uncertainty as to our long-term financial sustainability.
We expect to request additional draws under the Purchase Agreement in future periods. Over time, our dividend
obligation to Treasury will increasingly drive future draws. In addition, we are required under the Purchase Agreement to pay
a quarterly commitment fee to Treasury, which could also contribute to future draws if the fee is not waived in the future.
Treasury waived the fee for the first quarter of 2011, but it has indicated that it remains committed to protecting taxpayers
and ensuring that our future positive earnings are returned to taxpayers as compensation for their investment. The amount of
the quarterly commitment fee has not yet been established and could be substantial.
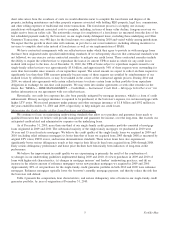
In addition, continued high levels of unemployment, adverse changes in home prices, interest rates, mortgage security
prices and spreads and other factors could lead to additional draws. For additional discussion of other factors that could
result in additional draws, see “MD&A — LIQUIDITY AND CAPITAL RESOURCES — Capital Resources.”
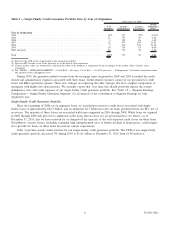
On February 11, 2011, the Obama Administration delivered a report to Congress that lays out the Administration’s plan
to reform the U.S. housing finance market, including options for structuring the government’s long-term role in a housing
finance system in which the private sector is the dominant provider of mortgage credit. The report recommends winding
down Freddie Mac and Fannie Mae, stating that the Obama Administration will work with FHFA to determine the best way
8Freddie Mac


