Freddie Mac 2010 Annual Report Download - page 10
Download and view the complete annual report
Please find page 10 of the 2010 Freddie Mac annual report below. You can navigate through the pages in the report by either clicking on the pages listed below, or by using the keyword search tool below to find specific information within the annual report.-
 1
1 -
 2
2 -
 3
3 -
 4
4 -
 5
5 -
 6
6 -
 7
7 -
 8
8 -
 9
9 -
 10
10 -
 11
11 -
 12
12 -
 13
13 -
 14
14 -
 15
15 -
 16
16 -
 17
17 -
 18
18 -
 19
19 -
 20
20 -
 21
21 -
22
-
23
-
24
-
25
-
26
-
27
-
28
-
29
-
30
-
31
-
32
-
33
-
34
-
35
-
36
-
37
-
38
-
39
-
40
-
41
-
42
-
43
-
44
-
45
-
46
-
47
-
48
-
49
-
50
-
51
-
52
-
53
-
54
-
55
-
56
-
57
-
58
-
59
-
60
-
61
-
62
-
63
-
64
-
65
-
66
-
67
-
68
-
69
-
70
-
71
-
72
-
73
-
74
-
75
-
76
-
77
-
78
-
79
-
80
-
81
-
82
-
83
-
84
-
85
-
86
-
87
-
88
-
89
-
90
-
91
-
92
-
93
-
94
-
95
-
96
-
97
-
98
-
99
-
100
-
101
-
102
-
103
-
104
-
105
-
106
-
107
-
108
-
109
-
110
-
111
-
112
-
113
-
114
-
115
-
116
-
117
-
118
-
119
-
120
-
121
-
122
-
123
-
124
-
125
-
126
-
127
-
128
-
129
-
130
-
131
-
132
-
133
-
134
-
135
-
136
-
137
-
138
-
139
-
140
-
141
-
142
-
143
-
144
-
145
-
146
-
147
-
148
-
149
-
150
-
151
-
152
-
153
-
154
-
155
-
156
-
157
-
158
-
159
-
160
-
161
-
162
-
163
-
164
-
165
-
166
-
167
-
168
-
169
-
170
-
171
-
172
-
173
-
174
-
175
-
176
-
177
-
178
-
179
-
180
-
181
-
182
-
183
-
184
-
185
-
186
-
187
-
188
-
189
-
190
-
191
-
192
-
193
-
194
-
195
-
196
-
197
-
198
-
199
-
200
-
201
-
202
-
203
-
204
-
205
-
206
-
207
-
208
-
209
-
210
-
211
-
212
-
213
-
214
-
215
-
216
-
217
-
218
-
219
-
220
-
221
-
222
-
223
-
224
-
225
-
226
-
227
-
228
-
229
-
230
-
231
-
232
-
233
-
234
-
235
-
236
-
237
-
238
-
239
-
240
-
241
-
242
-
243
-
244
-
245
-
246
-
247
-
248
-
249
-
250
-
251
-
252
-
253
-
254
-
255
-
256
-
257
-
258
-
259
-
260
-
261
-
262
-
263
-
264
-
265
-
266
-
267
-
268
-
269
-
270
-
271
-
272
-
273
-
274
-
275
-
276
-
277
-
278
-
279
-
280
-
281
-
282
-
283
-
284
-
285
-
286
-
287
-
288
-
289
-
290
-
291
-
292
-
293
-
294
-
295
-
296
-
297
-
298
-
299
-
300
-
301
-
302
-
303
-
304
-
305
-
306
-
307
-
308
-
309
-
310
-
311
-
312
-
313
-
314
-
315
-
316
-
317
-
318
-
319
-
320
-
321
-
322
-
323
-
324
-
325
-
326
-
327
-
328
-
329
-
330
-
331
-
332
-
333
-
334
-
335
-
336
-
337
-
338
-
339
-
340
-
341
-
342
-
343
-
344
-
345
-
346
-
347
-
348
-
349
-
350
-
351
-
352
-
353
-
354
-
355
-
356
 |
 |

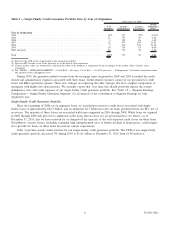
December 31, 2009. Liquidations have significantly exceeded our new guarantee activity during 2010, which drove the
decline in UPB of this portfolio.
Table 3 — Credit Statistics, Single-Family Credit Guarantee Portfolio
12/31/2010 09/30/2010 06/30/2010 03/31/2010 12/31/2009
As of
Payment status —
One month past due . . . ....................................... 2.07% 2.11% 2.02% 1.89% 2.24%
Two months past due . . ....................................... 0.78% 0.80% 0.77% 0.79% 0.95%
Seriously delinquent
(1)
........................................ 3.84% 3.80% 3.96% 4.13% 3.98%
Non-performing loans (in millions)
(2)
................................ $115,478 $112,746 $111,758 $110,079 $ 98,689
Single-family loan loss reserve (in millions)
(3)
.......................... $ 39,098 $ 37,665 $ 37,384 $ 35,969 $ 33,026
REO inventory (in units) . ....................................... 72,079 74,897 62,178 53,831 45,047
REO assets, net carrying value (in millions) ........................... $ 6,961 $ 7,420 $ 6,228 $ 5,411 $ 4,661
12/31/2010 09/30/2010 06/30/2010 03/31/2010 12/31/2009
For the Three Months Ended
(in units, unless noted)
Seriously delinquent loan additions
(1)
................................ 113,235 115,359 123,175 150,941 166,459
Loan modifications
(4)
........................................... 37,203 39,284 49,562 44,228 15,805
Foreclosure starts ratio
(5)
........................................ 0.73% 0.75% 0.61% 0.64% 0.57%
REO acquisitions
(6)
............................................ 23,771 39,053 34,662 29,412 24,749
REO disposition severity ratio:
(7)
California . . . .............................................. 43.9% 41.9% 42.0% 43.9% 44.4%
Florida ................................................... 53.0% 54.9% 53.8% 56.2% 54.3%
Arizona .................................................. 49.5% 46.6% 44.3% 45.3% 43.9%
Nevada .................................................. 53.1% 51.6% 49.4% 50.7% 50.4%
Michigan . . . .............................................. 49.7% 49.2% 47.2% 47.6% 48.9%
Total U.S.. . . .............................................. 41.3% 41.5% 39.2% 40.5% 40.1%
Single-family credit losses (in millions)
(6)
............................. $ 3,086 $ 4,216 $ 3,851 $ 2,907 $ 2,498
(1) See “MD&A — RISK MANAGEMENT — Credit Risk — Mortgage Credit Risk — Credit Performance — Delinquencies” for further information about
our reported serious delinquency rates.
(2) Consists of the UPB of loans in our single-family credit guarantee portfolio that have undergone a TDR or that are seriously delinquent.
(3) Consists of the combination of: (a) our allowance for loan losses on mortgage loans held for investment; and (b) our reserve for guarantee losses
associated with non-consolidated single-family mortgage securitization trusts and other guarantee commitments.
(4) Represents the number of completed modifications under agreement with the borrower during the quarter. Excludes forbearance agreements, repayment
plans, and loans in the trial period under HAMP.
(5) Represents the ratio of the number of loans that entered the foreclosure process during the respective quarter divided by the number of loans in the
portfolio at the end of the quarter. Excludes Other Guarantee Transactions and mortgages covered under other guarantee commitments.
(6) Our REO acquisition volume temporarily slowed in the fourth quarter of 2010 due to delays in the foreclosure process, including delays related to
concerns about deficiencies in foreclosure documentation practices, and reducing our credit losses for the period.
(7) Calculated as the amount of our losses recorded on disposition of REO properties during the respective quarterly period, excluding those subject to
repurchase requests made to our seller/servicers, divided by the aggregate UPB of the related loans. The amount of losses recognized on disposition of
the properties is equal to the amount by which the UPB of the loans exceeds the amount of sales proceeds from disposition of the properties. Excludes
sales commissions and other expenses, such as property maintenance and costs, as well as related recoveries from credit enhancements, such as
mortgage insurance.
Our REO disposition severity ratio was impacted in the fourth quarter of 2010, particularly in the state of Florida, by
temporary suspensions of REO sales by us and our seller/servicers related to concerns about deficiencies in foreclosure
documentation practices. We believe that these suspensions caused our REO disposition severity ratio in Florida to decline in
the fourth quarter of 2010, as compared to the third quarter of 2010, while most other states experienced an increase in this
ratio for the same periods.
As shown in Table 3 above, the number of seriously delinquent loan additions declined in each quarter of 2010.
However, our single-family credit guarantee portfolio continued to experience a high level of serious delinquencies and
foreclosure starts, as compared to periods before 2009. The credit losses of our single-family credit guarantee portfolio
increased in 2010, compared to 2009, due in part to the ongoing weakness in the U.S. economy. Other factors affecting
credit losses during the year include:
• Losses associated with an increase in the volume of foreclosures and foreclosure alternatives. These actions related to
efforts to resolve our significant inventory of seriously delinquent loans. This inventory accumulated in prior periods,
primarily during 2009, due to the lengthening in the foreclosure and modification timelines caused by various
suspensions of foreclosure transfers, process requirements for the implementation of HAMP, and constraints in
servicers’ capabilities to process large volumes of problem loans. Due to the length of time necessary for servicers
either to complete the foreclosure process or pursue foreclosure alternatives on seriously delinquent loans still in our
portfolio, we expect our credit losses will continue to rise even as the volume of new serious delinquencies declines.
7Freddie Mac