Eversource 2009 Annual Report Download - page 20
Download and view the complete annual report
Please find page 20 of the 2009 Eversource annual report below. You can navigate through the pages in the report by either clicking on the pages listed below, or by using the keyword search tool below to find specific information within the annual report.-
 1
1 -
2
-
3
-
4
-
5
-
6
-
7
-
8
-
9
-
 10
10 -
 11
11 -
 12
12 -
 13
13 -
 14
14 -
 15
15 -
 16
16 -
 17
17 -
 18
18 -
 19
19 -
 20
20 -
 21
21 -
 22
22 -
 23
23 -
 24
24 -
 25
25 -
 26
26 -
 27
27 -
 28
28 -
 29
29 -
 30
30 -
31
-
32
-
33
-
34
-
35
-
36
-
37
-
38
-
39
-
40
-
41
-
42
-
43
-
44
-
45
-
46
-
47
-
48
-
49
-
50
-
51
-
52
-
53
-
54
-
55
-
56
-
57
-
58
-
59
-
60
-
61
-
62
-
63
-
64
-
65
-
66
-
67
-
68
-
69
-
70
-
71
-
72
-
73
-
74
-
75
-
76
-
77
-
78
-
79
-
80
-
81
-
82
-
83
-
84
-
85
-
86
-
87
-
88
-
89
-
90
-
91
-
92
-
93
-
94
-
95
-
96
-
97
-
98
-
99
-
100
-
101
-
102
-
103
-
104
-
105
-
106
-
107
-
108
-
109
-
110
-
111
-
112
-
113
-
114
-
115
-
116
-
117
-
118
-
119
-
120
-
121
-
122
-
123
-
124
-
125
-
126
-
127
-
128
-
129
-
130
-
131
-
132
-
133
-
134
-
135
-
136
-
137
-
138
-
139
-
140
-
141
-
142
-
143
-
144
-
145
-
146
-
147
-
148
-
149
-
150
-
151
-
152
-
153
-
154
-
155
-
156
-
157
-
158
-
159
-
160
-
161
-
162
-
163
-
164
-
165
-
166
-
167
-
168
-
169
-
170
-
171
-
172
-
173
-
174
-
175
-
176
-
177
-
178
-
179
-
180
-
181
-
182
-
183
-
184
-
185
-
186
-
187
-
188
-
189
-
190
 |
 |

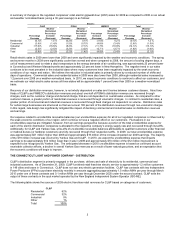
12
Year
(Millions of Dollars) 2009 2010 2011 2012 2013
2014
2010-2014
Totals
CL&P transmission $ 163 $ 136 $ 203 $ 281 $ 286 $ 155 $ 1,061
PSNH transmission 61 55 118 107 74 22 376
WMECO transmission 68 66 256 328 156 6 812
HQ tie line Project - 16 49 90 236 282 673
Subtotal transmission $ 292 $ 273 $ 626 $ 806 $ 752 $ 465 $ 2,922
CL&P distribution 283 305 313 306 305 317 1,546
PSNH distribution 99 113 111 115 121 134 594
WMECO distribution 38 33 39 36 35 36 179
Subtotal electric distribution $ 420 $ 451 $ 463 $ 457 $ 461 $ 487 $ 2,319
PSNH generation 145 187 117 82 68 26 480
WMECO generation - 20 14 7 - - 41
Subtotal generation $ 145 $ 207 $ 131 $ 89 $ 68 $ 26 $ 521
Yankee Gas distribution 60 112 104 80 82 83 461
Corporate service companies 52 48 25 22 25 14 134
Totals $ 969 $ 1,091 $ 1,349 $ 1,454 $ 1,388 $ 1,075 $ 6,357
For more information regarding NU and its subsidiaries' construction and capital improvement programs, see "Business Development
and Capital Expenditures" under Item 7, Management's Discussion and Analysis of Financial Condition and Results of Operations,
contained in this Annual Report on Form 10-K.
STATUS OF COMPETITIVE ENERGY BUSINESSES
Since 2005, we have been in the process of exiting our competitive energy businesses and are now focusing predominantly on our
regulated businesses. At December 31, 2009, our competitive businesses consisted of (i) Select Energy’s few remaining wholesale
energy marketing contracts, and NGS and its affiliates, which are winding down, and (ii) Boulos, NU Enterprises’ remaining active
electrical contracting business.
Select Energy’s wholesale energy contract with The New York Municipal Power Agency (NYMPA) and related energy supply contracts
expire in 2013. In addition to the NYMPA contract, Select Energy's only other long-term wholesale obligation is a contract to operate
and purchase the output of a generating facility in New England through mid-2012.
For more information regarding our exit from competitive businesses, see "NU Enterprises Divestitures" under Item 7, Management's
Discussion and Analysis of Financial Condition and Results of Operations, and Note 1B, "Summary of Significant Accounting Policies –
Presentation," to the Consolidated Financial Statements, in this Annual Report on Form 10-K.
FINANCING
We paid common dividends of $162.4 million in 2009, compared with $129.1 million in 2008. The increase is the result of increases of
6.3 percent and 11.8 percent in our common dividend rate that took effect in the third quarter of 2008 and in the first quarter of 2009,
respectively, and a higher number of shares outstanding in the second, third and fourth quarters of 2009. On February 9, 2010, our
Board of Trustees declared a common dividend of $0.25625 per share, ($1.025 on an annual basis) payable on March 31, 2010 to
shareholders of record as of March 1, 2010 representing an increase of approximately 7.9 percent over the 2009 dividend rate.
We target paying out approximately 50 percent of consolidated earnings in the form of common dividends. Our ability to pay common
dividends is subject to approval by our Board of Trustees and our future earnings and cash flow requirements and may be limited by
certain state statutes, the leverage restrictions in our revolving credit agreement and the ability of our subsidiaries to pay common
dividends to NU. The Federal Power Act limits the payment of dividends by CL&P, PSNH and WMECO to their respective retained
earnings balances unless a higher amount is approved by FERC, and PSNH is required to reserve an additional amount of retained
earnings under its FERC hydroelectric license conditions. Relevant state statutes may impose additional limitations on the payment of
dividends by the regulated companies. CL&P, PSNH, WMECO and Yankee Gas also are parties to a revolving credit agreement that
imposes leverage restrictions.
In general, the regulated companies pay approximately 60 percent of their earnings to NU parent in the form of common dividends. In
2009, CL&P, PSNH, WMECO, and Yankee Gas paid $113.8 million, $40.8 million, $18.2 million, and $19.1 million, respectively, in
common dividends to NU parent. In 2009, NU parent made equity contributions of $147.6 million, $68.9 million, $0.9 million and
$2.7 million to CL&P, PSNH, WMECO and Yankee Gas, respectively.