Eversource 2009 Annual Report Download - page 13
Download and view the complete annual report
Please find page 13 of the 2009 Eversource annual report below. You can navigate through the pages in the report by either clicking on the pages listed below, or by using the keyword search tool below to find specific information within the annual report.-
 1
1 -
2
-
 3
3 -
 4
4 -
 5
5 -
 6
6 -
 7
7 -
 8
8 -
 9
9 -
 10
10 -
 11
11 -
 12
12 -
 13
13 -
 14
14 -
 15
15 -
 16
16 -
 17
17 -
 18
18 -
 19
19 -
 20
20 -
 21
21 -
 22
22 -
 23
23 -
24
-
25
-
26
-
27
-
28
-
29
-
30
-
31
-
32
-
33
-
34
-
35
-
36
-
37
-
38
-
39
-
40
-
41
-
42
-
43
-
44
-
45
-
46
-
47
-
48
-
49
-
50
-
51
-
52
-
53
-
54
-
55
-
56
-
57
-
58
-
59
-
60
-
61
-
62
-
63
-
64
-
65
-
66
-
67
-
68
-
69
-
70
-
71
-
72
-
73
-
74
-
75
-
76
-
77
-
78
-
79
-
80
-
81
-
82
-
83
-
84
-
85
-
86
-
87
-
88
-
89
-
90
-
91
-
92
-
93
-
94
-
95
-
96
-
97
-
98
-
99
-
100
-
101
-
102
-
103
-
104
-
105
-
106
-
107
-
108
-
109
-
110
-
111
-
112
-
113
-
114
-
115
-
116
-
117
-
118
-
119
-
120
-
121
-
122
-
123
-
124
-
125
-
126
-
127
-
128
-
129
-
130
-
131
-
132
-
133
-
134
-
135
-
136
-
137
-
138
-
139
-
140
-
141
-
142
-
143
-
144
-
145
-
146
-
147
-
148
-
149
-
150
-
151
-
152
-
153
-
154
-
155
-
156
-
157
-
158
-
159
-
160
-
161
-
162
-
163
-
164
-
165
-
166
-
167
-
168
-
169
-
170
-
171
-
172
-
173
-
174
-
175
-
176
-
177
-
178
-
179
-
180
-
181
-
182
-
183
-
184
-
185
-
186
-
187
-
188
-
189
-
190
 |
 |

5
approximately 1,200 MW of electricity generation assets. Included in those generation assets is a 50 MW wood-burning generating unit
(Northern Wood Power Project) at its Schiller Station in Portsmouth, New Hampshire and approximately 70 MW of hydroelectric
generating units. PSNH also has contracts with certain IPPs, the output of which it uses to serve its customer load or sell into the
market.
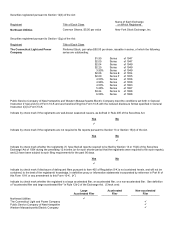
The following table shows the sources of 2009 electric franchise retail revenues based on categories of customers:
PSNH
Residential 49%
Commercial 39%
Industrial 11%
Other 1%
Total 100%
Rates
PSNH is subject to regulation by the New Hampshire Public Utilities Commission (NHPUC) which has jurisdiction over, among other
things, rates, certain dispositions of property and plant, mergers and consolidations, issuances of securities, standards of service,
management efficiency and construction and operation of facilities.
PSNH’s Energy Service (ES) rate recovers PSNH's generation and purchased power costs, including an ROE of 9.81 percent on its
generation assets. PSNH defers for future recovery or refund any difference between its ES revenues and the actual costs incurred.
Under New Hampshire law, the Stranded Cost Recovery Charge (SCRC) allows PSNH to recover its stranded costs, including
expenses incurred through mandated power contracts and other long-term investments and obligations. PSNH has financed a
significant portion of its stranded costs through securitization by issuing RRBs secured by the right to recover these stranded costs from
customers over time. It recovers the costs of these bonds through the SCRC rate. On an annual basis, PSNH files with the NHPUC an
ES/SCRC reconciliation filing for the preceding year. The difference between ES/SCRC revenues and ES/SCRC costs are included in
the ES/SCRC rate calculation and refunded to/recovered from customers in the subsequent period approved by the NHPUC. The
NHPUC’s last order, issued in December 2009, had no material impact on PSNH.
The Transmission Cost Adjustment Mechanism (TCAM) allows PSNH to recover on a fully reconciling basis its transmission related
costs. The TCAM is adjusted July 1 of each year.
Distribution Rates: In April 2009, PSNH filed an application with the NHPUC seeking a temporary increase of $36.4 million in
distribution rates on an annualized basis, effective August 1, 2009, and on June 30, 2009, PSNH filed an application requesting a
permanent increase of approximately $51 million on an annualized basis to be effective on August 1, 2009, and another $17 million
effective July 1, 2010. The application also requested a regulatory ROE of 10.5 percent. On July 31, 2009, the NHPUC approved a
settlement agreement on a temporary rate increase of $25.6 million effective August 1, 2009. PSNH expects a decision on the
permanent rate application in mid-2010. Any differences between temporary and permanent rates will be reconciled back to August 1,
2009.
For further information on PSNH’s rates and regulatory actions affecting it, see "Regulatory Developments and Rate Matters" in Item 7,
Management's Discussion and Analysis of Financial Condition and Results of Operations, in this Annual Report on Form 10-K.
Under the terms of the order issued by the NHPUC approving PSNH’s Northern Wood Power Project, a wood-burning unit which
replaced one of the three 50 MW coal-fired boiler units at the Schiller Station, certain revenue, credits and cost avoidances (revenue
sources) are shared between PSNH and its customers. These revenue sources include sales of renewable energy certificates (RECs)
to other utilities, brokers, or suppliers, production tax credits, and avoided CO2 allowance costs under regulations pursuant to the
Regional Greenhouse Gas Initiative (RGGI). In any given year, if the combination of revenue sources falls short of a stipulated revenue
level, PSNH and its customers each share half of any deficiency, and if the combination exceeds the stipulated revenue level, PSNH
and its customers each share half of any excess. Revenue sources exceeded stipulated levels in 2009 due to its performance and
favorable pricing in the Massachusetts and Rhode Island markets for the RECs. As a result, customers and shareholders will share
equally a benefit of about $13 million of incremental revenues for 2009.
PSNH's customers are entitled to choose competitive energy suppliers, with PSNH providing default energy service under its ES rate for
those customers who do not elect to use a third party supplier. Prior to 2009, PSNH experienced only a minimal amount of customer
migration. However, PSNH’s customer migration levels increased significantly in 2009 as energy costs decreased from their historic
high levels. Third party energy suppliers with more pricing flexibility were able to offer electricity supply at lower prices than PSNH. At
December 31, 2009, approximately 28.1 percent of PSNH’s customers, mostly large commercial and industrial customers, had switched
to other energy suppliers. The increased level of migration has caused an increase in the ES rate, as fixed costs must be spread over
lower sales volume and a smaller group of customers. The customers that did not switch to a third party supplier, predominately
residential and small commercial/industrial customers, are now paying a larger proportion of these fixed costs.
PSNH cannot predict if the upward pressure on ES rates will continue into the future, as future customer migration levels, which are
dependent on market prices and supplier alternatives, are uncertain. If future market prices once more exceed the ES rate level, some
or all of these customers on third party supply may migrate back to PSNH.