Eversource 2009 Annual Report Download - page 19
Download and view the complete annual report
Please find page 19 of the 2009 Eversource annual report below. You can navigate through the pages in the report by either clicking on the pages listed below, or by using the keyword search tool below to find specific information within the annual report.-
 1
1 -
2
-
3
-
4
-
5
-
6
-
7
-
8
-
 9
9 -
 10
10 -
 11
11 -
 12
12 -
 13
13 -
 14
14 -
 15
15 -
 16
16 -
 17
17 -
 18
18 -
 19
19 -
 20
20 -
 21
21 -
 22
22 -
 23
23 -
 24
24 -
 25
25 -
 26
26 -
 27
27 -
 28
28 -
 29
29 -
30
-
31
-
32
-
33
-
34
-
35
-
36
-
37
-
38
-
39
-
40
-
41
-
42
-
43
-
44
-
45
-
46
-
47
-
48
-
49
-
50
-
51
-
52
-
53
-
54
-
55
-
56
-
57
-
58
-
59
-
60
-
61
-
62
-
63
-
64
-
65
-
66
-
67
-
68
-
69
-
70
-
71
-
72
-
73
-
74
-
75
-
76
-
77
-
78
-
79
-
80
-
81
-
82
-
83
-
84
-
85
-
86
-
87
-
88
-
89
-
90
-
91
-
92
-
93
-
94
-
95
-
96
-
97
-
98
-
99
-
100
-
101
-
102
-
103
-
104
-
105
-
106
-
107
-
108
-
109
-
110
-
111
-
112
-
113
-
114
-
115
-
116
-
117
-
118
-
119
-
120
-
121
-
122
-
123
-
124
-
125
-
126
-
127
-
128
-
129
-
130
-
131
-
132
-
133
-
134
-
135
-
136
-
137
-
138
-
139
-
140
-
141
-
142
-
143
-
144
-
145
-
146
-
147
-
148
-
149
-
150
-
151
-
152
-
153
-
154
-
155
-
156
-
157
-
158
-
159
-
160
-
161
-
162
-
163
-
164
-
165
-
166
-
167
-
168
-
169
-
170
-
171
-
172
-
173
-
174
-
175
-
176
-
177
-
178
-
179
-
180
-
181
-
182
-
183
-
184
-
185
-
186
-
187
-
188
-
189
-
190
 |
 |
11
of pension expense or income (all of which are non-cash factors in determining rate base), totaled approximately $969.2 million, almost
all of which ($916.5 million) was expended by the regulated companies. The capital expenditures of these companies in 2010 are
estimated to total approximately $1.09 billion. Of this amount, approximately $441 million is expected to be expended by CL&P, $355
million by PSNH, $119 million by WMECO and $112 million by Yankee Gas. This capital budget includes anticipated costs for all
committed capital projects (i.e. generation, transmission, distribution, environmental compliance and others) and those reasonably
expected to become committed projects in 2010. We expect to evaluate needs beyond 2010 in light of future developments, such as
restructuring, industry consolidation, performance and other events. Increases in proposed distribution capital expenditures stem
primarily from increasing labor and material costs and an aging infrastructure. The costs (both labor and material) that our regulated
companies incur to construct and maintain their energy delivery systems have increased dramatically in recent years. These increases
have been driven primarily by higher demand for commodities and electrical products, as well as increased demand for skilled labor.
Our regulated companies have many major classes of equipment that are approaching or are beyond their useful lives, such as old
distribution poles, underground primary cables and substation switchgear. Replacement of this equipment is extremely costly.
CL&P’s transmission capital expenditures in 2009 totaled approximately $163 million compared to $586.3 million in 2008. The decrease
in transmission segment capital expenditures in 2009 as compared with 2008 was primarily due to the completion in 2008 of the major
southwest Connecticut transmission projects discussed above. For 2010, CL&P projects transmission capital expenditures of
approximately $136 million. During the period 2010 through 2014, CL&P plans to invest approximately $1.06 billion in transmission
projects, the majority of which will be for NEEWS.
In addition to its transmission projects, CL&P plans distribution capital expenditures to meet growth requirements and improve the
reliability of its distribution system. In 2009, CL&P's distribution capital expenditures totaled approximately $283 million. CL&P projects
its distribution capital expenditures in 2010 to be approximately $305 million. CL&P plans to spend approximately $1.55 billion on
distribution projects during the period 2010 through 2014. If all of the distribution and transmission projects are built as proposed,
CL&P’s rate base for electric transmission is projected to increase from approximately $2.1 billion at the end of 2009 to approximately
$2.56 billion by the end of 2014, and its rate base for distribution assets is projected to increase from approximately $2.1 billion to
approximately $2.91 billion over the same period.
In 2009, PSNH's transmission capital expenditures totaled approximately $61.1 million, its distribution capital expenditures totaled $98.8
million and its generation capital expenditures totaled $145 million. For 2010, PSNH projects transmission capital expenditures of
approximately $55 million, distribution capital expenditures of approximately $113 million and generation capital expenditures of
approximately $187 million. The increase in generation capital expenditures is mostly due to the expenditures for the Merrimack Clean
Air Project. During the period 2010 through 2014, PSNH plans to spend approximately $376 million on transmission projects,
approximately $594 million on distribution projects, and $480 million on generation projects. If all of the distribution, generation and
transmission projects are built as proposed, PSNH’s rate base for electric transmission is projected to increase from approximately
$315 million at the end of 2009 to approximately $584 million by the end of 2014, and its rate base for distribution and generation assets
is projected to increase from approximately $1.18 billion to approximately $2.0 billion over the same period.
In 2009, WMECO's transmission capital expenditures totaled approximately $67.7 million and its distribution capital expenditures totaled
approximately $37.7 million. In 2010, WMECO projects transmission capital expenditures of approximately $66 million, distribution
capital expenditures of approximately $33 million and $20 million on solar generation. During the period 2010 through 2014, WMECO
plans to spend approximately $812 million on transmission projects, with the bulk of that amount to be spent on the NEEWS Greater
Springfield Reliability Project, approximately $179 million on distribution projects and $41 million on solar generation. If all of the
generation, distribution and transmission projects are built as proposed, WMECO’s rate base for electric transmission is projected to
increase from approximately $183 million at the end of 2009 to approximately $851 million by the end of 2014 and its rate base for
distribution and generation assets is projected to increase from approximately $412 million to approximately $486 million over the same
period.
In 2009, Yankee Gas capital expenditures totaled approximately $59.6 million. For 2010, Yankee Gas projects total capital expenditures
of approximately $112 million. During the period 2010 through 2014, Yankee Gas plans on making approximately $461 million of capital
expenditures, including approximately $62.7 million on the WWL Project and the expansion of the Yankee Gas LNG plant's vaporization
output. If all of Yankee Gas projects are built as proposed, Yankee Gas investment in its regulated assets is projected to increase from
approximately $691 million at the end of 2009 to approximately $974 million by the end of 2014.
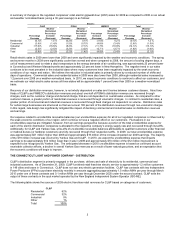
Projected Capital Expenditures: A summary of the capital expenditures for the regulated companies' transmission and the distribution
and generation segments, by company, for 2009, and projections for 2010 through 2014, including our corporate service companies'
capital expenditures on behalf of the regulated companies, is as follows: