Eversource 2009 Annual Report Download - page 11
Download and view the complete annual report
Please find page 11 of the 2009 Eversource annual report below. You can navigate through the pages in the report by either clicking on the pages listed below, or by using the keyword search tool below to find specific information within the annual report.-
 1
1 -
 2
2 -
 3
3 -
 4
4 -
 5
5 -
 6
6 -
 7
7 -
 8
8 -
 9
9 -
 10
10 -
 11
11 -
 12
12 -
 13
13 -
 14
14 -
 15
15 -
 16
16 -
 17
17 -
 18
18 -
 19
19 -
 20
20 -
 21
21 -
 22
22 -
23
-
24
-
25
-
26
-
27
-
28
-
29
-
30
-
31
-
32
-
33
-
34
-
35
-
36
-
37
-
38
-
39
-
40
-
41
-
42
-
43
-
44
-
45
-
46
-
47
-
48
-
49
-
50
-
51
-
52
-
53
-
54
-
55
-
56
-
57
-
58
-
59
-
60
-
61
-
62
-
63
-
64
-
65
-
66
-
67
-
68
-
69
-
70
-
71
-
72
-
73
-
74
-
75
-
76
-
77
-
78
-
79
-
80
-
81
-
82
-
83
-
84
-
85
-
86
-
87
-
88
-
89
-
90
-
91
-
92
-
93
-
94
-
95
-
96
-
97
-
98
-
99
-
100
-
101
-
102
-
103
-
104
-
105
-
106
-
107
-
108
-
109
-
110
-
111
-
112
-
113
-
114
-
115
-
116
-
117
-
118
-
119
-
120
-
121
-
122
-
123
-
124
-
125
-
126
-
127
-
128
-
129
-
130
-
131
-
132
-
133
-
134
-
135
-
136
-
137
-
138
-
139
-
140
-
141
-
142
-
143
-
144
-
145
-
146
-
147
-
148
-
149
-
150
-
151
-
152
-
153
-
154
-
155
-
156
-
157
-
158
-
159
-
160
-
161
-
162
-
163
-
164
-
165
-
166
-
167
-
168
-
169
-
170
-
171
-
172
-
173
-
174
-
175
-
176
-
177
-
178
-
179
-
180
-
181
-
182
-
183
-
184
-
185
-
186
-
187
-
188
-
189
-
190
 |
 |

3
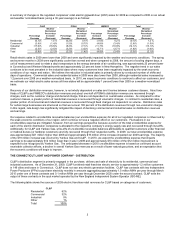
A summary of changes in the regulated companies’ retail electric gigawatt-hour (GWh) sales for 2009 as compared to 2008 on an actual
and weather normalized basis (using a 30-year average) is as follows:
Electric
CL&P PSNH WMECO Total
Percentage
Decrease
Weather
Normalized
Percentage
Increase/
(Decrease)
Percentage
Decrease
Weather
Normalized
Percentage
Increase/
(Decrease)
Percentage
Increase/
(Decrease)
Weather
Normalized
Percentage
Increase/
(Decrease)
Percentage
Decrease
Weather
Normalized
Percentage
Increase/
(Decrease)
Residential (0.7)% 1.5 % (0.2)% 0.6 % (1.6)% 0.2 % (0.7)% 1.2 %
Commercial (2.9)% (1.4)% (1.5)% (0.7)% (4.8)% (3.4)% (2.8)% (1.5)%
Industrial (17.6)% (16.6)% (8.2)% (7.1)% (11.7)% (10.9)% (14.1)% (13.1)%
Other (2.5)% (2.5)% (3.2)% (3.2)% 12.7 % 12.7 % (1.6)% (1.6)%
Total (3.8)% (2.1)% (2.2)% (1.4)% (4.8)% (3.4)% (3.5)% (2.1)%
Retail electric sales in 2009 were lower than 2008 and were significantly impacted by the weather and economic conditions. The spring
and summer months in 2009 were significantly cooler than normal and when compared to 2008, the amount of cooling degree days, a
unit of measurement used to relate a day's temperature to the energy demands of air conditioning, was approximately 23 percent lower
in Connecticut and Western Massachusetts and approximately 22 percent lower in New Hampshire. The negative trend in our sales
continues to be most prevalent in the industrial class where many customers have been negatively impacted by the weak economic
conditions of our region and nation. We believe the reduction in industrial sales is primarily driven by a reduced number of shifts and
days of operations. Commercial sales and residential sales in 2009 were also lower than 2008, although residential sales increased by
1.2 percent over 2008 on a weather-normalized basis. In 2010, we expect economic conditions to continue to affect our customers, and
we estimate our retail electric sales across all three states will be approximately 1 percent lower than 2009 on a weather-normalized
basis.
Recovery of our distribution revenues, however, is not wholly dependent on sales and it varies between customer classes. About two-
thirds of CL&P’s and WMECO’s distribution revenues and about one-half of PSNH’s distribution revenue are recovered through
charges, such as the customer charge and demand charge, that are not dependent on overall sales volumes. As compared to other
customer classes, a greater portion of residential revenues is recovered through volumetric charges. In contrast to residential rates, a
greater portion of commercial and industrial revenues is recovered through fixed charges not dependent on volume. Distribution rates
for certain large businesses are structured so that we recover 100 percent of the distribution revenues through non-volumetric charges.
In this regard, rate design has significantly mitigated the impact of declining commercial and industrial sales on distribution revenues
and earnings.
Our expense related to uncollectible receivable balances (our uncollectibles expense) for all of our regulated companies is influenced by
the weak economic conditions of our region, which continue to have a negative effect on our customers. Fluctuations in our
uncollectibles expense are mitigated, however, from an earnings perspective because a portion of the total uncollectibles expense for
each of the electric distribution companies is allocated to the respective company’s energy supply rate and recovered through its tariffs.
Additionally, for CL&P and Yankee Gas, write-offs of uncollectible receivable balances attributable to qualified customers under financial
or medical duress (or hardship customers) are fully recovered through their respective tariffs. In 2009, our total uncollectibles expense
was approximately $21 million higher than 2008 and approximately $19 million of the increase impacted our 2009 earnings. The majority
of the $19 million increase was incurred by Yankee Gas and CL&P. In 2010, we expect the uncollectibles expense that impacts
earnings to be approximately $12 million lower than it was in 2009 and approximately $10 million of the $12 million improvement is
expected to be recognized by Yankee Gas. The anticipated decrease in 2010 uncollectibles expense is based on continued account
receivable collection efforts, a decline in overall Yankee Gas revenues as a result of lower natural gas prices, and an expectation that
the economic conditions will begin to improve.
THE CONNECTICUT LIGHT AND POWER COMPANY - DISTRIBUTION
CL&P’s distribution segment is primarily engaged in the purchase, delivery and sale of electricity to its residential, commercial and
industrial customers. As of December 31, 2009, CL&P furnished retail franchise electric service to approximately 1.2 million customers
in 149 cities and towns in Connecticut. CL&P does not own any electric generation facilities. CL&P has contracts with two Independent
Power Producers (IPPs) to purchase electricity monthly in amounts aggregating approximately 1.5 million MWh per year through March
2015 under one of these contracts and 0.1 million MWh per year through December 2020 under the second contract. CL&P sells the
output of these contracts in the spot market operated by the New England Independent System Operator (ISO-NE).
The following table shows the sources of 2009 electric franchise retail revenues for CL&P based on categories of customers:
CL&P
Residential 62%
Commercial 32%
Industrial 5%
Other 1%
Total 100%