Eversource 2009 Annual Report Download - page 16
Download and view the complete annual report
Please find page 16 of the 2009 Eversource annual report below. You can navigate through the pages in the report by either clicking on the pages listed below, or by using the keyword search tool below to find specific information within the annual report.-
 1
1 -
2
-
3
-
4
-
5
-
 6
6 -
 7
7 -
 8
8 -
 9
9 -
 10
10 -
 11
11 -
 12
12 -
 13
13 -
 14
14 -
 15
15 -
 16
16 -
 17
17 -
 18
18 -
 19
19 -
 20
20 -
 21
21 -
 22
22 -
 23
23 -
 24
24 -
 25
25 -
 26
26 -
27
-
28
-
29
-
30
-
31
-
32
-
33
-
34
-
35
-
36
-
37
-
38
-
39
-
40
-
41
-
42
-
43
-
44
-
45
-
46
-
47
-
48
-
49
-
50
-
51
-
52
-
53
-
54
-
55
-
56
-
57
-
58
-
59
-
60
-
61
-
62
-
63
-
64
-
65
-
66
-
67
-
68
-
69
-
70
-
71
-
72
-
73
-
74
-
75
-
76
-
77
-
78
-
79
-
80
-
81
-
82
-
83
-
84
-
85
-
86
-
87
-
88
-
89
-
90
-
91
-
92
-
93
-
94
-
95
-
96
-
97
-
98
-
99
-
100
-
101
-
102
-
103
-
104
-
105
-
106
-
107
-
108
-
109
-
110
-
111
-
112
-
113
-
114
-
115
-
116
-
117
-
118
-
119
-
120
-
121
-
122
-
123
-
124
-
125
-
126
-
127
-
128
-
129
-
130
-
131
-
132
-
133
-
134
-
135
-
136
-
137
-
138
-
139
-
140
-
141
-
142
-
143
-
144
-
145
-
146
-
147
-
148
-
149
-
150
-
151
-
152
-
153
-
154
-
155
-
156
-
157
-
158
-
159
-
160
-
161
-
162
-
163
-
164
-
165
-
166
-
167
-
168
-
169
-
170
-
171
-
172
-
173
-
174
-
175
-
176
-
177
-
178
-
179
-
180
-
181
-
182
-
183
-
184
-
185
-
186
-
187
-
188
-
189
-
190
 |
 |

8
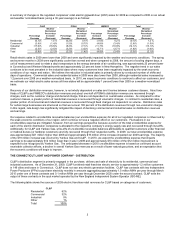
A summary of firm natural gas sales in million cubic feet for Yankee Gas for 2009 and 2008 and the percentage changes in 2009 as
compared to 2008 on an actual and weather normalized basis (using a 30-year average) is as follows:
Firm Natural Gas
Sales (mcf)
2009 2008
Percent
Increase
Weather Normalized
Percentage
(Decrease)/Increase
Residential 13,562 13,467 0.7% (1.8)%
Commercial 14,063 12,939 8.7% 6.3 %
Industrial 14,825 13,311 11.3% 10.7 %
Total 42.450 39,717 6.9% 5.0 %
Actual and weather normalized firm natural gas sales in 2009 were higher than 2008. The 2009 results for the commercial and
industrial classes have benefitted substantially from the addition of new gas-fired distributed generation in Yankee Gas' service region
during the last twelve to fifteen months. Yankee Gas recovers almost half of its total distribution revenues through non-usage charges,
and thus, similar to our electric distribution companies, changes in sales have less of an impact on revenues. In 2010, we estimate our
total weather normalized firm natural gas sales will be essentially the same as 2009.
On January 6, 2010, the DPUC issued a decision approving Yankee Gas' request to sell its four remaining propane plants that were
used to supply gas during peak periods. As a result, in order to meet future supply needs during peak periods, Yankee Gas has
initiated a project to construct 16 miles of main gas pipeline between Waterbury, Connecticut and Wallingford, Connecticut and an
expansion of the Yankee Gas LNG facility’s vaporization output (collectively, the WWL Project), which together are estimated to cost
approximately $67 million. The WWL Project will connect the LNG storage facility, which is located in Waterbury, Connecticut and is
capable of storing the equivalent of 1.2 Bcf of natural gas, to areas with growing demand. We expect to begin construction on this
project in the second quarter of 2010 and complete it by the end of 2011.
Rates
Yankee Gas is subject to regulation by the DPUC, which has jurisdiction over, among other things, rates, accounting procedures,
certain dispositions of property and plant, mergers and consolidations, issuances of long-term securities, standards of service,
management efficiency and construction and operation of distribution, production and storage facilities.
Under a settlement of its distribution rate filing with the Connecticut Office of Consumer Counsel and the DPUC’s Prosecutorial Division
in 2007, Yankee Gas’ base rate increased, effective July 1, 2007, by $22 million, or 4.2 percent, net of expected pipeline and commodity
cost savings resulting primarily from completion of Yankee Gas’ LNG facility, and Yankee Gas was allowed an authorized regulatory
ROE of 10.1 percent. Yankee Gas is required to return to customers 100 percent of all earnings in excess of the allowed 10.1 percent
regulatory ROE. It has not been necessary for Yankee Gas to return any earnings to customers as its regulatory ROE was 6.6 percent
in 2009 and 8.3 percent in 2008. Yankee Gas is considering filing a rate case for new rates with the DPUC.
Sources and Availability of Natural Gas Supply
The DPUC requires that Yankee Gas meet the needs of its firm customers under all weather conditions. Specifically, Yankee Gas must
structure its portfolio to meet customer needs under a design day scenario (defined as the coldest day in 30 years) and under a design
year scenario (defined as the average of the four coldest years in the last 30 years). Yankee Gas’ LNG facility enables Yankee Gas to
buy natural gas in periods of low demand, store it and use it during peak demand periods when prices are typically higher. Yankee Gas’
on-system stored LNG and underground storage supplies help to meet consumption needs during the coldest days of winter. Yankee
Gas obtains its interstate supplies from the three interstate pipelines that currently serve Connecticut: the Algonquin, Tennessee and
Iroquois Pipelines. Yankee Gas has long-term firm contracts for capacity on TransCanada Pipelines Limited pipeline, Vector Pipeline,
L.P., Tennessee Gas Pipeline, Algonquin Pipeline, and Texas Eastern Transmission, L.P. pipelines. Yankee Gas considers such
transportation arrangements adequate for its needs.
REGULATED ELECTRIC TRANSMISSION
General
CL&P, PSNH and WMECO and most other New England utilities, generation owners and marketers are parties to a series of
agreements that provide for coordinated planning and operation of the region's generation and transmission facilities and the rules by
which they participate in the wholesale markets and acquire transmission services. Under these arrangements, ISO-NE, a non-profit
corporation whose board of directors and staff are independent from all market participants, has served as the Regional Transmission
Operator (RTO) of the New England transmission system since February 1, 2005. ISO-NE works to ensure the reliability of the system,
administers the independent system operator tariff, subject to FERC approval, oversees the efficient and competitive functioning of the
regional wholesale power market and determines which costs of our major transmission facilities are shared by consumers throughout
New England.