Duke Energy 2010 Annual Report Download - page 6
Download and view the complete annual report
Please find page 6 of the 2010 Duke Energy annual report below. You can navigate through the pages in the report by either clicking on the pages listed below, or by using the keyword search tool below to find specific information within the annual report.-
 1
1 -
 2
2 -
 3
3 -
 4
4 -
 5
5 -
 6
6 -
 7
7 -
 8
8 -
 9
9 -
 10
10 -
 11
11 -
 12
12 -
 13
13 -
 14
14 -
 15
15 -
 16
16 -
 17
17 -
18
-
19
-
20
-
21
-
22
-
23
-
24
-
25
 |
 |

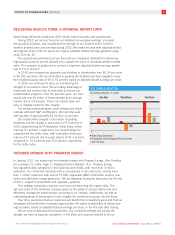
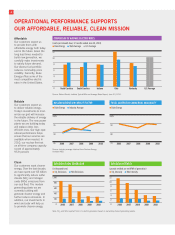
OPERATIONAL PERFORMANCE SUPPORTS
OUR AFFORDABLE, RELIABLE, CLEAN MISSION
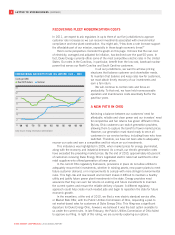
Affordable
Our customers expect us
to provide them with
affordable energy both today
and in the future. Given the
long lead times needed to
build new generation, we
carefully make investments
to satisfy future demand.
Our diverse fuel portfolio
reduces commodity price
volatility. Currently, Duke
Energy offers some of the
most competitive electric
rates in the United States.
Reliable
Our customers expect us
to deliver reliable energy.
Today’s investments to mod-
ernize our grid will increase
the reliable delivery of energy
in the future. The new power
plants we are building today
will replace older, less
efficient ones. Our high oper-
ational performance helps
ensure that our services are
available when needed. In
2010, our nuclear fleet set
an all-time company capacity
record of approximately
95.9 percent.
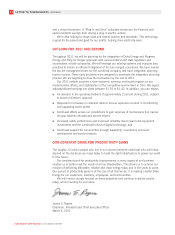
Clean
Our customers want cleaner
energy. Over the last decade,
we have spent over $5 billion
to significantly reduce sulfur
dioxide (SO2) and nitrogen
oxide (NOx) emissions from
our coal fleet. The modern
generating plants we are
currently building will
generate cleaner energy and
further reduce emissions. In
addition, our investments in
wind and solar will help us
to promote cleaner energy.
(cents per kilowatt-hour, 12 months ended June 30, 2010)
Duke Energy State Average U.S. Average
12
10
8
6
4
2
0
Source: Edison Electric Institute Typical Bills and Average Rates Report, June 30, 2010.
North Carolina South Carolina Indiana Ohio Kentucky U.S. Average
COMPARISON OF AVERAGE ELECTRIC RATES
Duke Energy Industry Average
100%
95
90
85
Source: Industry average obtained from Nuclear Energy
Institute (NEI)
2006 2007 2008 2009 2010
NUCLEAR GENERATION CAPACITY FACTOR
90
95
100
Duke Energy
100%
90
80
70 2006 2007 2008 2009 2010
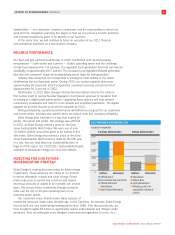
FOSSIL GENERATION COMMERCIAL AVAILABILITY
(in thousand tons)
SO2 Emissions NOx Emissions
1,000
800
600
400
200
0 2006 2007 2008 2009 2010
EMISSIONS FROM GENERATION
(pounds emitted per net MWh of generation)
SO2 Intensity NOx Intensity
12
10
8
6
4
2
0 2006 2007 2008 2009 2010
EMISSIONS INTENSITY
Note: SO2 and NOx reported from U.S. electric generation based on ownership share of generating assets.
4