Duke Energy 2010 Annual Report Download - page 23
Download and view the complete annual report
Please find page 23 of the 2010 Duke Energy annual report below. You can navigate through the pages in the report by either clicking on the pages listed below, or by using the keyword search tool below to find specific information within the annual report.-
 1
1 -
2
-
3
-
4
-
5
-
6
-
7
-
8
-
9
-
10
-
11
-
12
-
 13
13 -
 14
14 -
 15
15 -
 16
16 -
 17
17 -
 18
18 -
 19
19 -
 20
20 -
 21
21 -
 22
22 -
 23
23 -
 24
24 -
 25
25
 |
 |

DUKE ENERGY CORPORATION / 2010 ANNUAL REPORT
21
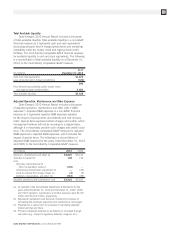
Total Available Liquidity
Duke Energy’s 2010 Annual Report includes a discussion
of total available liquidity. Total available liquidity is a non-GAAP
financial measure as it represents cash and cash equivalents
(excluding amounts held in foreign jurisdictions) and remaining
availability under the master credit and regional bank credit
facilities. The most directly comparable GAAP financial measure
for available liquidity is cash and cash equivalents. The following
is a reconciliation of total available liquidity as of December 31,
2010, to the most directly comparable GAAP measure:
As of
(In millions) December 31, 2010
Cash and cash equivalents $1,670
Less: Amounts held in foreign jurisdictions (724)
946
Plus: Remaining availability under master credit
and regional bank credit facilities 2,482
Total available liquidity $3,428
Adjusted Operation, Maintenance and Other Expenses
Duke Energy’s 2010 Annual Report includes a discussion
of adjusted operation, maintenance and other costs (“O&M
expenses”). Adjusted O&M expenses is a non-GAAP financial
measure as it represents reported O&M expenses adjusted
for the impact of special items and deferrals and cost recovery
riders. Special items represent certain charges and credits, which
management believes will not be recurring on a regular basis,
although it is reasonably possible such charges and credits could
recur. The most directly comparable GAAP measure for adjusted
O&M expenses is reported O&M expenses, which includes the
impact of special items. The following is a reconciliation of
adjusted O&M expenses for the years ended December 31, 2010
and 2009, to the most directly comparable GAAP measure:
(In millions) 2010 2009
Operation, maintenance and other (a) $3,825 $3,313
Transfers to capital (b) 108 149
Less:
Voluntary retirement plan &
office consolidation costs (c) (164) —
International transmission adjustment (c) — (30)
Costs to achieve the Cinergy merger (c) (4) (5)
Deferrals, recoverables, and other (d) (343) (85)
Adjusted operations and maintenance cost $3,422 $3,342
(a) As reported in the Consolidated Statements of Operations for the
years ended December 31, 2010 and December 31, 2009. 2008
and 2007 operation, maintenance and other expenses were $3,351
million and $3,324 million, respectively.
(b) Represents capitalized costs that were included for purposes of
calculating the employee operations and maintenance costs target.
(c) Presented as a special item for purposes of calculating adjusted
diluted earnings per share.
(d) Primarily represents expenses to be deferred or recovered through
rate riders (e.g., impact of regulatory deferrals, reagents, etc.).