Dillard's 2004 Annual Report Download - page 18
Download and view the complete annual report
Please find page 18 of the 2004 Dillard's annual report below. You can navigate through the pages in the report by either clicking on the pages listed below, or by using the keyword search tool below to find specific information within the annual report.-
 1
1 -
2
-
3
-
4
-
5
-
6
-
7
-
 8
8 -
 9
9 -
 10
10 -
 11
11 -
 12
12 -
 13
13 -
 14
14 -
 15
15 -
 16
16 -
 17
17 -
 18
18 -
 19
19 -
 20
20 -
 21
21 -
 22
22 -
 23
23 -
 24
24 -
 25
25 -
 26
26 -
 27
27 -
 28
28 -
29
-
30
-
31
-
32
-
33
-
34
-
35
-
36
-
37
-
38
-
39
-
40
-
41
-
42
-
43
-
44
-
45
-
46
-
47
-
48
-
49
-
50
-
51
-
52
-
53
-
54
-
55
-
56
-
57
-
58
-
59
-
60
 |
 |

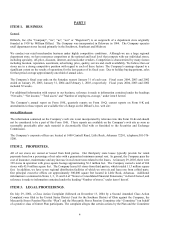
new store locations or tax planning, the Company’s effective tax rate and tax balances could be affected. As such these
estimates may require adjustment in the future as additional facts become known or as circumstances change.
The Company’s income tax returns are periodically audited by various state and local jurisdictions. Additionally, the
Internal Revenue Service audits the Company’s federal income tax return annually. The Company reserves for tax
contingencies when it is probable that a liability has been incurred and the contingent amount is reasonably estimable.
These reserves are based upon the Company's best estimation of the potential exposures associated with the timing and
amount of deductions as well as various tax filing positions. Due to the complexity of these examination issues, for
which reserves have been recorded, it may be several years before the final resolution is achieved.
Discount rate. The discount rate that the Company utilizes for determining future pension obligations is based on the
Moody’s AA corporate bond index. The indices selected reflect the weighted average remaining period of benefit
payments. The discount rate had decreased to 5.5% as of January 29, 2005 from 6.00% as of January 31, 2004. A further
50 basis point change in the discount rate would generate an experience gain or loss of approximately $9 million.
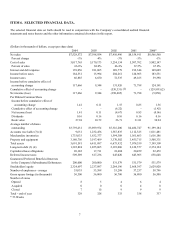
Results of Operations
The following table sets forth the results of operations and percentage of net sales, for the periods indicated:
(in millions of dollars) For the years ended
January 29, 2005 January 31, 2004 February 1, 2003
% of % of % of
Amount Net Sales Amount Net Sales Amount Net Sales
Net sales $7,528.6 100.0 % $7,598.9 100.0 % $7,911.0 100.0 %
Cost of sales 5,017.8 66.6 5,170.2 68.0 5,254.1 66.4
Gross profit 2,510.8 33.4 2,428.7 32.0 2,656.9 33.6
Advertising, selling, administrative
and general expenses 2,098.8 27.9 2,097.9 27.6 2164.0 27.3
Depreciation and amortization 301.9 4.0 290.7 3.8 301.4 3.8
Rentals 54.8 0.7 64.1 0.8 68.1 0.9
Interest and debt expense 139.1 1.8 181.1 2.4 189.8 2.4
Asset impairment and store closing
charges 19.4 0.3 43.7 0.6 52.2 0.7
Total operating expenses 2,614.0 34.7 2,677.5 35.2 2,775.5 35.1
Service charges, interest and other
income 287.7 3.8 264.8 3.4 322.9
4.1
Income before income taxes 184.5 2.5 16.0 0.2 204.3 2.6
Income taxes 66.9 0.9 6.7 0.1 72.4 0.9
Income before cumulative effec
t
of accounting change 117.6 1.6 9.3 0.1 131.9 1.7
Cumulative effect of accounting change - - - - (530.3) (6.7)
Net income (loss) $ 117.6 1.6 % $ 9.3 0.1 % $(398.4) (5.0) %
14