Dillard's 2004 Annual Report Download - page 11
Download and view the complete annual report
Please find page 11 of the 2004 Dillard's annual report below. You can navigate through the pages in the report by either clicking on the pages listed below, or by using the keyword search tool below to find specific information within the annual report.-
 1
1 -
 2
2 -
 3
3 -
 4
4 -
 5
5 -
 6
6 -
 7
7 -
 8
8 -
 9
9 -
 10
10 -
 11
11 -
 12
12 -
 13
13 -
 14
14 -
 15
15 -
 16
16 -
 17
17 -
 18
18 -
 19
19 -
 20
20 -
 21
21 -
 22
22 -
23
-
24
-
25
-
26
-
27
-
28
-
29
-
30
-
31
-
32
-
33
-
34
-
35
-
36
-
37
-
38
-
39
-
40
-
41
-
42
-
43
-
44
-
45
-
46
-
47
-
48
-
49
-
50
-
51
-
52
-
53
-
54
-
55
-
56
-
57
-
58
-
59
-
60
 |
 |

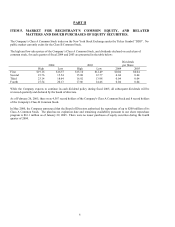
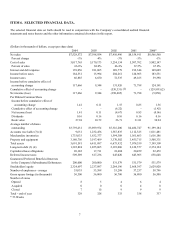
ITEM 6. SELECTED FINANCIAL DATA.
The selected financial data set forth should be read in conjunction with the Company’s consolidated audited financial
statements and notes thereto and the other information contained elsewhere in this report.
(Dollars in thousands of dollars, except per share data)
2004 2003 2002 2001 2000*
Net sales $7,528,572 $7,598,934 $7,910,996 $8,154,911 $8,566,560
Percent change -1% -4% -3% -5% -1%
Cost of sales 5,017,765 5,170,173 5,254,134 5,507,702 5,802,147
Percent of sales 66.6% 68.0% 66.4% 67.5% 67.8%
Interest and debt expense 139,056 181,065 189,779 192,344 169,609
Income before taxes 184,551 15,994 204,261 120,963 183,531
Income taxes 66,885 6,650 72,335 49,165 59,390
Income before cumulative effect of
accounting change 117,666 9,344 131,926 71,798 124,141
Cumulative effect of accounting change - - (530,331) (1) - (129,991) (2)
Net income (loss) 117,666 9,344 (398,405) 71,798 (5,850)
Per Diluted Common Share
Income before cumulative effect of
accounting change 1.41 0.11 1.55 0.85 1.36
Cumulative effect of accounting change - - (6.22) - (1.42)
Net income (loss) 1.41 0.11 (4.67) 0.85 (0.06)
Dividends 0.16 0.16 0.16 0.16 0.16
Book value 27.94 26.79 26.71 31.81 30.94
Average number of shares
outstanding 83,739,431 83,899,974 85,316,200 84,486,747 91,199,184
Accounts receivable (3) (4) 9,651 1,232,456 1,387,835 1,112,325 1,011,481
Merchandise inventories 1,733,033 1,632,377 1,594,308 1,561,863 1,616,186
Property and equipment 3,180,756 3,197,469 3,370,502 3,455,715 3,508,331
Total assets 5,691,581 6,411,097 6,675,932 7,074,559 7,199,309
Long-term debt (3) (4) 1,322,824 1,855,065 2,193,006 2,124,577 2,374,124
Capitalized lease obligations 20,182 17,711 18,600 20,459 22,453
Deferred income taxes 509,589 617,236 645,020 643,965 638,648
Guaranteed Preferred Beneficial Interests
in the Company's Subordinated Debentures 200,000 200,000 531,579 531,579 531,579
Stockholders' equity 2,324,697 2,237,097 2,264,196 2,668,397 2,629,820
Number of employees - average 53,035 53,598 55,208 57,257 58,796
Gross square footage (in thousands) 56,300 56,000 56,700 56,800 56,500
Number of stores
Opened 85 4 6 4
Acquired 0 0 0 4 0
Closed 7 10 9 9 9
Total - end of year 329 328 333 338 337
* 53 Weeks
7