Cincinnati Bell 2001 Annual Report Download - page 66
Download and view the complete annual report
Please find page 66 of the 2001 Cincinnati Bell annual report below. You can navigate through the pages in the report by either clicking on the pages listed below, or by using the keyword search tool below to find specific information within the annual report.-
 1
1 -
2
-
3
-
4
-
5
-
6
-
7
-
8
-
9
-
10
-
11
-
12
-
13
-
14
-
15
-
16
-
17
-
18
-
19
-
20
-
21
-
22
-
23
-
24
-
25
-
26
-
27
-
28
-
29
-
30
-
31
-
32
-
33
-
34
-
35
-
36
-
37
-
38
-
39
-
40
-
41
-
42
-
43
-
44
-
45
-
46
-
47
-
48
-
49
-
50
-
51
-
52
-
53
-
54
-
55
-
 56
56 -
 57
57 -
 58
58 -
 59
59 -
 60
60 -
 61
61 -
 62
62 -
 63
63 -
 64
64 -
 65
65 -
 66
66 -
 67
67 -
 68
68 -
 69
69 -
 70
70
 |
 |

64
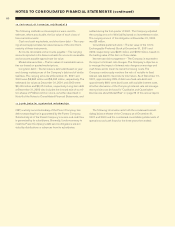
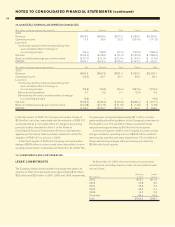
19. COMMITMENTS AND CONTINGENCIE S
LEASE COMMITMENTS
The Company leases certain facilities and equipment used in its
operations. Total rental expenses were approximately $42 million,
$32 million and $23 million in 2001, 2000 and 1999, respectively.
At December 31, 2001, the total minimum annual rental
commitments, excluding interest, under noncancelable leases
are as follows:
Operating Capital
($ in millions) Leases Leases
2002 $42.1 $11.2
2003 37.8 8.4
2004 33.8 5.4
2005 26.5 3.1
2006 19.2 2.3
Thereafter 85.0 18.3
Total $244.4 $48.7
NOTES TO CONSOLIDATED FINANCIAL STATEMENTS (continued)
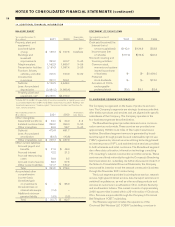
18. QUARTER LY FINANCIAL INFORMATION (UNAUDITED)
($ in millions, except per common share amounts) First Second Third Fourth Total
2001
Revenue $578.3 $608.0 $597.9 $ 566.3 $2,350.5
Operating income 17.5 26.9 22.2 (237.9) (171.3)
Loss from:
Continuing operations before extraordinary item
and cumulative effect of change in
accounting principle (34.0) (28.7) (27.9) (195.6) (286.2)
Net loss $ (34.0) $ (28.7) $ (27.9) $(195.6) $ (286.2)
Basic and diluted earnings per common share $ (0.17) $ (0.14) $ (0.14) $ (0.91) $ (1.36)
EBITDA $154.7 $162.0 $165.6 $ 143.2 $ 625.5
($ in millions, except per common share amounts) First Second Third Fourth To tal
2000
Revenue $460.2 $497.8 $531.2 $ 560.9 $2,050.1
Operating income (25.6) 20.7 20.1 24.0 39.1
Loss from:
Continuing operations before extraordinary item
and cumulative effect of change in
accounting principle (55.6) (29.5) (23.4) (267.8) (376.5)
Discontinued operations 0.1 0.2 0.1 (0.3) 0.2
Extraordinary item and cumulative effect of change
in accounting principle (0.8) — — — (0.8)
Net loss $ (56.3) $ (29.3) $ (23.3) $(268.1) $ (377.1)
Basic and diluted earnings per common share $ (0.28) $ (0.15) $ (0.12) $ (1.26) $ (1.82)
EBITDA $ 85.0 $129.7 $137.3 $ 146.0 $ 498.0
In the first quarter of 2000, the Company incurred a charge of
$0.8 million, net of tax, associated with the adoption of SAB 101
and presented as a cumulative effect of change in accounting
principle (further described in Note 1 of the Notes to
Consolidated Financial Statements). Revenue and expenses
appearing in the above table have been restated to reflect the
adoption of SAB 101 on January 1, 2000.
In the fourth quarter of 2000, the Company incurred a pretax
charge of $405 million in order to write down its portfolio of minor-
ity equity investments to market value at December 31, 2000. The
Company also recognized approximately $17 million in pretax
gains resulting from the liquidation of the Company’s investment in
PurchasePro.com. The net effect of these investment losses
reduced earnings per share by $1.08 in the fourth quarter.
In the fourth quarter of 2001, the Company incurred a pretax
charge included in operating income of $232 million related to
restructuring activities and asset impairments. The net effect of
these restructuring charges reduced earnings per share by
$0.69 in the fourth quarter.