Cincinnati Bell 2001 Annual Report Download - page 43
Download and view the complete annual report
Please find page 43 of the 2001 Cincinnati Bell annual report below. You can navigate through the pages in the report by either clicking on the pages listed below, or by using the keyword search tool below to find specific information within the annual report.-
 1
1 -
2
-
3
-
4
-
5
-
6
-
7
-
8
-
9
-
10
-
11
-
12
-
13
-
14
-
15
-
16
-
17
-
18
-
19
-
20
-
21
-
22
-
23
-
24
-
25
-
26
-
27
-
28
-
29
-
30
-
31
-
32
-
 33
33 -
 34
34 -
 35
35 -
 36
36 -
 37
37 -
 38
38 -
 39
39 -
 40
40 -
 41
41 -
 42
42 -
 43
43 -
 44
44 -
 45
45 -
 46
46 -
 47
47 -
 48
48 -
 49
49 -
 50
50 -
 51
51 -
 52
52 -
 53
53 -
54
-
55
-
56
-
57
-
58
-
59
-
60
-
61
-
62
-
63
-
64
-
65
-
66
-
67
-
68
-
69
-
70
 |
 |

41
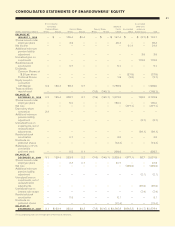
CONSOLIDATED STATEMENTS OF SHAREOWNERS’ EQUITY
6
3
⁄
4
% Cumulative Accumulated
Convertible Additional Other Com-
Preferred Shares Common Shares Treasury Shares Paid-in Accumulated prehensive
(Dollars and shares in millions) Shares Amount Shares Amount Shares Amount Capital Deficit Income (Loss) Total
BALANCE AT
JANUARY 1, 1999 — $ — 136.4 $1.4 — $ — $ 147.4 $ — $ (6.7) $ 142.1
Shares issued under
employee plans — — 3.2 — — — 46.3 — — 46.3
Net income — — — — — — — 31.4 — 31.4
Additional minimum
pension liability
adjustment — — — — — — — — 3.6 3.6
Unrealized gain on
investments — — — — — — — — 170.0 170.0
Restricted stock
amortization — — 0.7 — — — 5.1 — — 5.1
Dividends:
Common Shares, at
$.20 per share — — — — — — — (27.5) — (27.5)
Preferred Shares — — — — — — 1.8 (3.9) — (2.1)
Equity issued in
connection
with Merger 0.2 129.4 68.4 0.7 — — 1,778.9 — — 1,909.0
Treasury shares
repurchased — — — — (7.8) (145.1) — — — (145.1)
BALANCE AT
DECEM B E R 31, 19 9 9 0.2 129.4 208.7 2.1 (7.8) (145.1) 1,979.5 — 166.9 2,132.8
Shares issued under
employee plans — — 5.0 — — — 130.0 — — 130.0
Net loss — — — — — — — (377.1) — (377.1)
Depository share
conversion 2.9 — — — — — — — — —
Additional minimum
pension liability
adjustment — — — — — — — — (0.1) (0.1)
Unrealized loss on
investments, net of
reclassification
adjustments — — — — — — — — (84.1) (84.1)
Restricted stock
amortization — — 0.1 — — — 3.6 — — 3.6
Dividends on
preferred shares — — — — — — (12.3) — — (12.3)
Redemption of 71⁄2%
convertible
preferred stock — — 9.5 0.1 — — 228.6 — — 228.7
BALANCE AT
DECEM B E R 31, 2000 3.1 129.4 223.3 2.2 (7.8) (145.1) 2,329.4 (377.1) 82.7 2,021.5
Shares issued under
employee plans — — 2.3 0.1 — — 40.7 — — 40.8
Net loss — — — — — — — (286.2) — (286.2)
Additional minimum
pension liability
adjustment — — — — — — — — (0.1) (0.1)
Unrealized loss on
investments, net of
reclassification
adjustments — — — — — — — — (85.9) (85.9)
Unrealized loss on
interest rate swaps — — — — — — — — (7.4) (7.4)
Restricted stock
amortization — — 0.3 — — — 6.1 — — 6.1
Dividends on
preferred shares — — — — — — (10.4) — — (10.4)
BALANCE AT
DECEM B E R 31, 20013.1 $129.4 225.9 $2.3 (7.8) $(145.1) $2,365.8 $(663.3) $ (10.7) $1,678.4
The accompanying notes are an integral part of the financial statements.