Cincinnati Bell 2001 Annual Report Download - page 64
Download and view the complete annual report
Please find page 64 of the 2001 Cincinnati Bell annual report below. You can navigate through the pages in the report by either clicking on the pages listed below, or by using the keyword search tool below to find specific information within the annual report.-
 1
1 -
2
-
3
-
4
-
5
-
6
-
7
-
8
-
9
-
10
-
11
-
12
-
13
-
14
-
15
-
16
-
17
-
18
-
19
-
20
-
21
-
22
-
23
-
24
-
25
-
26
-
27
-
28
-
29
-
30
-
31
-
32
-
33
-
34
-
35
-
36
-
37
-
38
-
39
-
40
-
41
-
42
-
43
-
44
-
45
-
46
-
47
-
48
-
49
-
50
-
51
-
52
-
53
-
 54
54 -
 55
55 -
 56
56 -
 57
57 -
 58
58 -
 59
59 -
 60
60 -
 61
61 -
 62
62 -
 63
63 -
 64
64 -
 65
65 -
 66
66 -
 67
67 -
 68
68 -
 69
69 -
 70
70
 |
 |

62
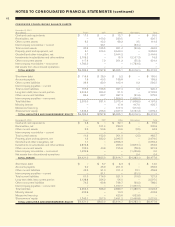
NOTES TO CONSOLIDATED FINANCIAL STATEMENTS (continued)
CONDEN S E D CONSOLI DATING BALANCE SH E ETS
December 31, 2001
($ in millions) Parent CBT Other Eliminations Total
Cash and cash equivalents $ 17.3 $ — $ 12.7 $ — $ 30.0
Receivables, net — 100.2 220.5 — 320.7
Other current assets 6.3 42.2 68.2 2.5 119.2
Intercompany receivables — current — 23.1 — (23.1) —
Total current assets 23.6 165.5 301.4 (20.6) 469.9
Property, plant and equipment, net 2.1 614.4 2,443.0 — 3,059.5
Goodwill and other intangibles, net 0.7 — 2,444.2 — 2,444.9
Investments in subsidiaries and other entities 2,158.2 — 15.3 (2,157.2) 16.3
Other noncurrent assets 117.6 7.9 251.2 (55.3) 321.4
Intercompany receivables — noncurrent 1,783.0 — — (1,783.0) —
Net assets from discontinued operations — — — — —
TOTAL ASSETS $4,085.2 $787.8 $5,455.1 $(4,016.1) $6,312.0
Short-term debt $ 118.8 $ 28.0 $ 3.2 $ — $ 150.0
Accounts payable 1.9 49.2 138.8 — 189.9
Other current liabilities 36.6 89.3 445.4 9.2 580.5
Intercompany payables — current — — — — —
Total current liabilities 157.3 166.5 587.4 9.2 920.4
Long-term debt, less current portion 2,306.3 304.2 91.5 — 2,702.0
Other noncurrent liabilities 89.4 60.7 487.3 (61.9) 575.5
Intercompany payables — noncurrent — — 1,806.2 (1,806.2) —
Total liabilities 2,553.0 531.4 2,972.4 (1,858.9) 4,197.9
Minority interest — — 17.8 417.9 435.7
Mezzanine financing — — 417.9 (417.9) —
Shareowners’ equity 1,532.2 256.4 2,047.0 (2,157.2) 1,678.4
TOTAL LIABI LITIES AND SHAREOW N E R S’ EQUITY$4,085.2 $787.8 $5,455.1 $(4,016.1) $6,312.0
December 31, 2000 Parent CBT Other Eliminations Total
Cash and cash equivalents $ 5.8 $ — $ 32.1 $ — $ 37.9
Receivables, net — 101.4 229.2 — 330.6
Other current assets 5.5 50.6 40.6 (2.5) 94.2
Intercompany receivables — current — — — — —
Total current assets 11.3 152.0 301.9 (2.5) 462.7
Property, plant and equipment, net 1.3 632.2 2,345.5 — 2,979.0
Goodwill and other intangibles, net 1.1 — 2,558.3 — 2,559.4
Investments in subsidiaries and other entities 2,874.8 — 253.2 (2,873.1) 254.9
Other noncurrent assets 102.9 40.8 155.8 (78.3) 221.2
Intercompany receivables — noncurrent 1,429.6 — — (1,429.6) 0.0
Net assets from discontinued operations — — — 0.4 0.4
TOTAL ASSETS $4,421.0 $825.0 $5,614.7 $(4,383.1) $6,477.6
Short-term debt $ — $ 5.7 $ 8.3 $ — $ 14.0
Accounts payable 9.0 45.9 201.6 — 256.5
Other current liabilities 42.0 91.3 311.4 12.1 456.8
Intercompany payables — current — 31.1 — (31.1) —
Total current liabilities 51.0 174.0 521.3 (19.0) 727.3
Long-term debt, less current portion 2,128.8 324.2 54.0 — 2,507.0
Other noncurrent liabilities 74.5 69.8 736.7 (93.0) 788.0
Intercompany payables — noncurrent — — 1,377.7 (1,377.7) —
Total liabilities 2,254.3 568.0 2,689.7 (1,489.7) 4,022.3
Minority interest 423.6 — 10.2 — 433.8
Mezzanine financing — — 423.6 (423.6) —
Shareowners’ equity 1,743.1 257.0 2,491.2 (2,469.8) 2,021.5
TOTAL LIABI LITIES AND SHAREOW N E R S’ EQUITY$4,421.0 $825.0 $5,614.7 $(4,383.1) $6,477.6