Cincinnati Bell 2001 Annual Report Download - page 59
Download and view the complete annual report
Please find page 59 of the 2001 Cincinnati Bell annual report below. You can navigate through the pages in the report by either clicking on the pages listed below, or by using the keyword search tool below to find specific information within the annual report.-
 1
1 -
2
-
3
-
4
-
5
-
6
-
7
-
8
-
9
-
10
-
11
-
12
-
13
-
14
-
15
-
16
-
17
-
18
-
19
-
20
-
21
-
22
-
23
-
24
-
25
-
26
-
27
-
28
-
29
-
30
-
31
-
32
-
33
-
34
-
35
-
36
-
37
-
38
-
39
-
40
-
41
-
42
-
43
-
44
-
45
-
46
-
47
-
48
-
 49
49 -
 50
50 -
 51
51 -
 52
52 -
 53
53 -
 54
54 -
 55
55 -
 56
56 -
 57
57 -
 58
58 -
 59
59 -
 60
60 -
 61
61 -
 62
62 -
 63
63 -
 64
64 -
 65
65 -
 66
66 -
 67
67 -
 68
68 -
 69
69 -
70
 |
 |

57
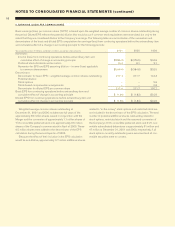
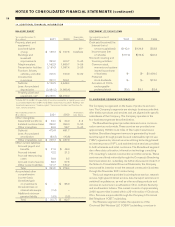
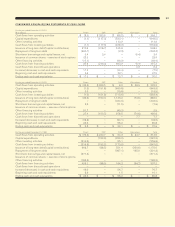
The following table summarizes the status of Company stock options outstanding and exercisable at December 31, 2001:
(Shares in thousands) Options Outstanding Options Exercisable
Weighted Average
Remaining
Contractual Weighted Average
Range of Exercise Prices Shares Life in Years Exercise Price Shares Exercise Price
$ 1.44 to $ 9.645 9,115 8.60 $ 8.84 1,753 $ 5.47
$ 9.90 to $16.7813 11,143 6.89 $15.43 6,062 $14.58
$17.50 to $24.9375 8,610 8.25 $21.56 2,626 $20.28
$24.97 to $38.1875 4,901 8.15 $30.51 1,145 $31.38
Total 33,769 7.88 $17.40 11,586 $16.15
includes a provision for option grants to employees hired after
the January 1999 grant date, in smaller amounts and at an exer-
cise price based on the month of hire (e.g., employees hired
during 2001 receive options to purchase up to 300 common
shares of the Company). Grant recipients must exercise their
options by January 2009. The Company does not expect a signif-
icant amount of dilution as a result of this grant.
In December 2001, the Company announced an additional
stock option grant to a majority of its management employees.
Each eligible employee was granted 300 options to purchase
common shares at an exercise price of $9.645. The options vest
over a period of three years and expire ten years from the date of
grant. The Company does not expect a significant amount of dilu-
tion as a result of this grant.
Restricted stock awards during 2001, 2000 and 1999 were
65,000 shares, 362,184 shares and 739,250 shares, respec-
tively. The weighted average market value of the shares on the
grant date were $24.41 in 2001, $25.54 in 2000, and $17.37 in
1999, respectively. Restricted stock awards generally vest within
one to five years. Total compensation expense for restricted
stock awards during 2001, 2000 and 1999 was $6.1 million,
$3.8 million and $5.1 million, respectively.
In January 1999, the Company announced stock option
grants to each of its then existing employees (approximately
3,500). According to the terms of this program, stock option
grant recipients remaining with the Company until January 2002
can exercise their options to purchase up to 500 common
shares each at an exercise price of $16.75. This plan also
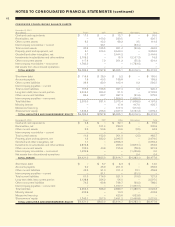
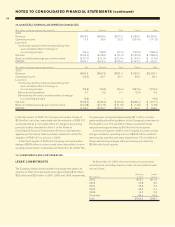
13. DISCONTIN U E D OPERATIONS
On May 23, 2000, the Company completed the sale of its
Cincinnati Bell Supply (“CBS”) subsidiary. Accordingly, the net
income, net assets and net cash flows of CBS have been
reported as “discontinued operations” in the 2000 and 1999
financial statements.
Summarized financial information for the discontinued opera-
tions is as follows:
Year ended December 31 ($ in millions) 2000 1999
R E S U LTS OF OPERATIONS
Revenue $13.1 $29.1
Income (loss) before income taxes (0.9) 5.4
Income tax provision (benefit) (0.4) 2.0
Income (loss) from operations (0.5) 3.4
Gain on sale of discontinued
operations, net of tax 0.7 —
Net income $ 0.2 $ 3.4
F I NANCIAL POSITION
Current assets $ 0.5 $10.4
Total assets 0.5 11.0
Current liabilities 0.1 3.0
Total liabilities 0.1 3.1
Net assets of discontinued operations $ 0.4 $ 7.9
The Company incurred costs for product purchases from
CBS of $0.9 million and $7.9 million in 2000 and 1999, respec-
tively. The effective tax rates for discontinued operations in 2000
and 1999 were 44% and 37%, respectively.