Cincinnati Bell 2001 Annual Report Download - page 35
Download and view the complete annual report
Please find page 35 of the 2001 Cincinnati Bell annual report below. You can navigate through the pages in the report by either clicking on the pages listed below, or by using the keyword search tool below to find specific information within the annual report.-
 1
1 -
2
-
3
-
4
-
5
-
6
-
7
-
8
-
9
-
10
-
11
-
12
-
13
-
14
-
15
-
16
-
17
-
18
-
19
-
20
-
21
-
22
-
23
-
24
-
 25
25 -
 26
26 -
 27
27 -
 28
28 -
 29
29 -
 30
30 -
 31
31 -
 32
32 -
 33
33 -
 34
34 -
 35
35 -
 36
36 -
 37
37 -
 38
38 -
 39
39 -
 40
40 -
 41
41 -
 42
42 -
 43
43 -
 44
44 -
 45
45 -
46
-
47
-
48
-
49
-
50
-
51
-
52
-
53
-
54
-
55
-
56
-
57
-
58
-
59
-
60
-
61
-
62
-
63
-
64
-
65
-
66
-
67
-
68
-
69
-
70
 |
 |

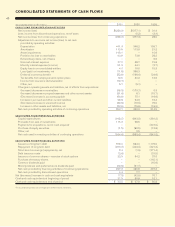
CASH FLOW
In 2001, cash provided by operating activities totaled $259 mil-
lion, $73 million lower than the $332 million generated during
2000, as a lower net loss was more than offset by increased
working capital.
The Company’s significant investing activities included out-
flows for capital expenditures and inflows from the sale of equity
investments. Capital expenditures in 2001 totaled $649 million,
$195 million lower than the $844 million spent in 2000. The
decrease is due to completion of both the national network and
its optical overbuild in addition to the completion of the wireless
network footprint and installation of ADSL-enabling equipment at
CBT. The Company received proceeds of $115 million from the
sale of its entire equity stake in PSINet, Applied Theory and Corvis.
Consistent with 2000, no dividends were paid on common
stock in 2001. However, approximately $11 million in preferred
stock dividends were paid to holders of the 63⁄4% preferred stock
during 2001 (cash payments in 2000 included the 71⁄4% preferred
stock which was converted into common shares of the Company
in April 2000). Additionally, the Company switched to cash pay-
ments of dividends on its 121⁄2% preferred stock on November 16,
1999, and approximately $49 million in dividends were paid on
this preferred stock in 2000 and 2001. This amount is included in
the “Minority interest expense (income)” caption in the Consolidated
Statements of Operations and Comprehensive Income (Loss).
Please refer to Notes 7 and 8 of the Notes to Consolidated
Financial Statements for a detailed discussion of minority interest
and preferred stock.
During 2001, the Company increased its net borrowings
under its credit facility by $308 million. The Company incurred
additional debt of $30 million from payment-in-kind interest on the
63⁄4% Notes. Please see Note 5 of the Notes to Consolidated
Financial Statements for a detailed discussion of indebtedness.
Approximately $23 million in cash was generated through the
issuance of common shares of the Company as a result of stock
option exercises during 2001. This compares to approximately
$64 million generated in 2000 from the exercise of stock options.
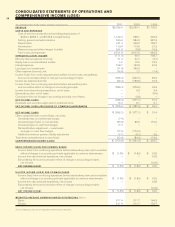
EBITDA
EBITDA represents net income (loss) from continuing operations
before interest, income tax expense (benefit), depreciation, amor-
tization, restructuring and other charges (credits), minority interest
expense (income), equity loss in unconsolidated entities, loss
(gain) on investments, other expense (income), extraordinary
items and the effect of changes in accounting principles. EBITDA
does not represent cash flow for the periods presented and
should not be considered as an alternative to net income (loss) as
an indicator of the Company’s operating performance or as an
alternative to cash flows as a source of liquidity, and may not be
comparable with EBITDA as defined by other companies. The
Company has presented certain information regarding EBITDA
because the Company believes that EBITDA is generally
accepted as providing useful information regarding a company’s
ability to service and incur debt. In addition, the Company uses
EBITDA as a key measurement of operating segment performance.
EBITDA of $626 million in 2001 increased 26%, or $128 mil-
lion, versus 2000, with all segments contributing to the increase.
The Broadband segment contributed 22% of the increase or
$29 million as the segment continued to leverage its network
investment. The Wireless segment constituted 37% or $48 million
of the increase as it recognized economies from a nearly com-
pleted network and brand name equity built over previous periods.
The Local segment contributed 24% of the increase or $30 million
as aggressive cost management helped leverage incremental rev-
enue of $39 million. The Other segment added 18% of the
EBITDA growth for 2001, or $23 million, substantially due to mar-
ket share gains by CBAD. These increases were offset by
corporate eliminations.
EBITDA of $498 million in 2000 represented a $168 million,
or 51% improvement over the $330 million reported in 1999. The
Broadband segment contributed $80 million in additional
EBITDA as a result of the Merger and operating improvements
realized during 2000. The Local and Wireless segments provided
increases of $73 million and $44 million, respectively, as these
segments began to more fully leverage previous network invest-
ment and promotional efforts. This was somewhat offset by the
declining EBITDA of the Other segment which was primarily
attributable to advertising and other start-up costs associated
with the Any Distance service. EBITDA margin decreased by six
margin points to 24%, as a significant decrease in the EBITDA
margin of the Other segment was partially offset by the improve-
ments of the remaining segments.
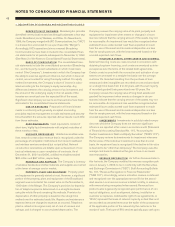
REGULATORY MATTERS AND COMPETITIVE TRENDS
FEDERAL The Telecommunications Act of 1996 (the
“1996 Act”), including the rules subsequently adopted by the
Federal Communications Commission (“FCC”) to implement the
1996 Act, can be expected to impact CBT’s in-territory local
exchange operations in the form of greater competition.
STATE At the state level, CBT conducts local exchange
operations in portions of Ohio, Kentucky and Indiana and, con-
sequently, is subject to regulation by the Public Utilities
Commissions (“PUC”) in those states. In Ohio, the PUC is con-
cluding a proceeding that will establish permanent rates that CBT
can charge to competitive local exchange carriers for unbundled
33