CenturyLink 2015 Annual Report Download - page 87
Download and view the complete annual report
Please find page 87 of the 2015 CenturyLink annual report below. You can navigate through the pages in the report by either clicking on the pages listed below, or by using the keyword search tool below to find specific information within the annual report.-
 1
1 -
2
-
3
-
4
-
5
-
6
-
7
-
8
-
9
-
10
-
11
-
12
-
13
-
14
-
15
-
16
-
17
-
18
-
19
-
20
-
21
-
22
-
23
-
24
-
25
-
26
-
27
-
28
-
29
-
30
-
31
-
32
-
33
-
34
-
35
-
36
-
37
-
38
-
39
-
40
-
41
-
42
-
43
-
44
-
45
-
46
-
47
-
48
-
49
-
50
-
51
-
52
-
53
-
54
-
55
-
56
-
57
-
58
-
59
-
60
-
61
-
62
-
63
-
64
-
65
-
66
-
67
-
68
-
69
-
70
-
71
-
72
-
73
-
74
-
75
-
76
-
 77
77 -
 78
78 -
 79
79 -
 80
80 -
 81
81 -
 82
82 -
 83
83 -
 84
84 -
 85
85 -
 86
86 -
 87
87 -
 88
88 -
 89
89 -
 90
90 -
 91
91 -
 92
92 -
 93
93 -
 94
94 -
 95
95 -
 96
96 -
 97
97 -
98
-
99
-
100
-
101
-
102
-
103
-
104
-
105
-
106
-
107
-
108
-
109
-
110
-
111
-
112
-
113
-
114
-
115
-
116
-
117
-
118
-
119
-
120
-
121
-
122
-
123
-
124
-
125
-
126
-
127
-
128
-
129
-
130
-
131
-
132
-
133
-
134
-
135
-
136
-
137
-
138
-
139
-
140
-
141
-
142
-
143
-
144
-
145
-
146
-
147
-
148
-
149
-
150
-
151
-
152
-
153
-
154
-
155
-
156
-
157
-
158
-
159
-
160
-
161
-
162
-
163
-
164
-
165
-
166
-
167
-
168
-
169
-
170
-
171
-
172
-
173
-
174
-
175
-
176
-
177
-
178
-
179
-
180
-
181
-
182
-
183
-
184
-
185
-
186
-
187
-
188
-
189
-
190
-
191
-
192
-
193
-
194
-
195
-
196
-
197
-
198
-
199
-
200
-
201
-
202
 |
 |

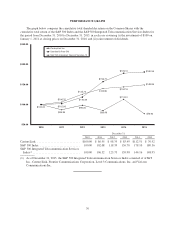
PERFORMANCE GRAPH
The graph below compares the cumulative total shareholder return on the Common Shares with the
cumulative total return of the S&P 500 Index and the S&P 500 Integrated Telecommunication Services Index for
the period from December 31, 2010 to December 31, 2015, in each case assuming (i) the investment of $100 on
January 1, 2011 at closing prices on December 31, 2010, and (ii) reinvestment of dividends.
$100.00
$76.92
$148.95
$180.56
$112.51
$144.16
$178.10
$85.49
$139.98
$156.70
$86.95
$118.39
$98.35
$125.73
$102.08
$106.32
$100.00
$250.00
$200.00
$150.00
CenturyLink Inc.
Standard & Poor 500
S&P 500 Integrated Telecom Services (1)
$50.00
2010 20152011 2012 2013 2014
December 31,
2010 2011 2012 2013 2014 2015
CenturyLink ............................. $100.00 $ 86.95 $ 98.35 $ 85.49 $112.51 $ 76.92
S&P 500 Index ........................... 100.00 102.08 118.39 156.70 178.10 180.56
S&P 500 Integrated Telecommunication Services
Index(1) ................................ 100.00 106.32 125.73 139.98 144.16 148.95
(1) As of December 31, 2015, the S&P 500 Integrated Telecommunication Services Index consisted of AT&T
Inc., CenturyLink, Frontier Communications Corporation, Level 3 Communications, Inc. and Verizon
Communications Inc.
76