CenturyLink 2015 Annual Report Download - page 186
Download and view the complete annual report
Please find page 186 of the 2015 CenturyLink annual report below. You can navigate through the pages in the report by either clicking on the pages listed below, or by using the keyword search tool below to find specific information within the annual report.-
 1
1 -
2
-
3
-
4
-
5
-
6
-
7
-
8
-
9
-
10
-
11
-
12
-
13
-
14
-
15
-
16
-
17
-
18
-
19
-
20
-
21
-
22
-
23
-
24
-
25
-
26
-
27
-
28
-
29
-
30
-
31
-
32
-
33
-
34
-
35
-
36
-
37
-
38
-
39
-
40
-
41
-
42
-
43
-
44
-
45
-
46
-
47
-
48
-
49
-
50
-
51
-
52
-
53
-
54
-
55
-
56
-
57
-
58
-
59
-
60
-
61
-
62
-
63
-
64
-
65
-
66
-
67
-
68
-
69
-
70
-
71
-
72
-
73
-
74
-
75
-
76
-
77
-
78
-
79
-
80
-
81
-
82
-
83
-
84
-
85
-
86
-
87
-
88
-
89
-
90
-
91
-
92
-
93
-
94
-
95
-
96
-
97
-
98
-
99
-
100
-
101
-
102
-
103
-
104
-
105
-
106
-
107
-
108
-
109
-
110
-
111
-
112
-
113
-
114
-
115
-
116
-
117
-
118
-
119
-
120
-
121
-
122
-
123
-
124
-
125
-
126
-
127
-
128
-
129
-
130
-
131
-
132
-
133
-
134
-
135
-
136
-
137
-
138
-
139
-
140
-
141
-
142
-
143
-
144
-
145
-
146
-
147
-
148
-
149
-
150
-
151
-
152
-
153
-
154
-
155
-
156
-
157
-
158
-
159
-
160
-
161
-
162
-
163
-
164
-
165
-
166
-
167
-
168
-
169
-
170
-
171
-
172
-
173
-
174
-
175
-
 176
176 -
 177
177 -
 178
178 -
 179
179 -
 180
180 -
 181
181 -
 182
182 -
 183
183 -
 184
184 -
 185
185 -
 186
186 -
 187
187 -
 188
188 -
 189
189 -
 190
190 -
 191
191 -
 192
192 -
 193
193 -
 194
194 -
 195
195 -
 196
196 -
197
-
198
-
199
-
200
-
201
-
202
 |
 |

Fair value is defined as the price that would be received to sell an asset or paid to transfer a liability in an
orderly transaction between independent and knowledgeable parties who are willing and able to transact for an
asset or liability at the measurement date. We use valuation techniques that maximize the use of observable
inputs and minimize the use of unobservable inputs when determining fair value and then we rank the estimated
values based on the reliability of the inputs used following the fair value hierarchy set forth by the FASB.
We determined the fair values of our long-term debt, including the current portion, based on quoted market
prices where available or, if not available, based on discounted future cash flows using current market interest
rates.
The three input levels in the hierarchy of fair value measurements are defined by the FASB generally as
follows:
Input Level Description of Input
Level 1 Observable inputs such as quoted market prices in active markets.
Level 2 Inputs other than quoted prices in active markets that are either directly or indirectly observable.
Level 3 Unobservable inputs in which little or no market data exists.
The following table presents the carrying amounts and estimated fair values of our long-term debt,
excluding capital lease and other obligations, as well as the input levels used to determine the fair values
indicated below:
As of December 31, 2015 As of December 31, 2014
Input
Level
Carrying
Amount
Fair
Value
Carrying
Amount
Fair
Value
(Dollars in millions)
Liabilities-Long-term debt excluding capital lease and
other obligations ............................ 2 $19,800 19,473 19,994 21,255
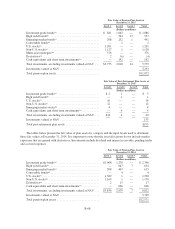
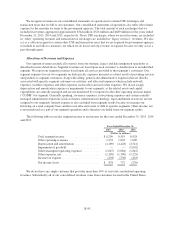
(11) Income Taxes
Years Ended December 31,
2015 2014 2013
(Dollars in millions)
Income tax expense was as follows:
Federal
Current ................................... $ 28 18 1
Deferred .................................. 329 305 403
State
Current ................................... 40 26 62
Deferred .................................. 21 (14) (8)
Foreign
Current ................................... 16 3 9
Deferred .................................. 4 — (4)
Total income tax expense ........................ $438 338 463
B-78