CenturyLink 2015 Annual Report Download - page 147
Download and view the complete annual report
Please find page 147 of the 2015 CenturyLink annual report below. You can navigate through the pages in the report by either clicking on the pages listed below, or by using the keyword search tool below to find specific information within the annual report.-
 1
1 -
2
-
3
-
4
-
5
-
6
-
7
-
8
-
9
-
10
-
11
-
12
-
13
-
14
-
15
-
16
-
17
-
18
-
19
-
20
-
21
-
22
-
23
-
24
-
25
-
26
-
27
-
28
-
29
-
30
-
31
-
32
-
33
-
34
-
35
-
36
-
37
-
38
-
39
-
40
-
41
-
42
-
43
-
44
-
45
-
46
-
47
-
48
-
49
-
50
-
51
-
52
-
53
-
54
-
55
-
56
-
57
-
58
-
59
-
60
-
61
-
62
-
63
-
64
-
65
-
66
-
67
-
68
-
69
-
70
-
71
-
72
-
73
-
74
-
75
-
76
-
77
-
78
-
79
-
80
-
81
-
82
-
83
-
84
-
85
-
86
-
87
-
88
-
89
-
90
-
91
-
92
-
93
-
94
-
95
-
96
-
97
-
98
-
99
-
100
-
101
-
102
-
103
-
104
-
105
-
106
-
107
-
108
-
109
-
110
-
111
-
112
-
113
-
114
-
115
-
116
-
117
-
118
-
119
-
120
-
121
-
122
-
123
-
124
-
125
-
126
-
127
-
128
-
129
-
130
-
131
-
132
-
133
-
134
-
135
-
136
-
 137
137 -
 138
138 -
 139
139 -
 140
140 -
 141
141 -
 142
142 -
 143
143 -
 144
144 -
 145
145 -
 146
146 -
 147
147 -
 148
148 -
 149
149 -
 150
150 -
 151
151 -
 152
152 -
 153
153 -
 154
154 -
 155
155 -
 156
156 -
 157
157 -
158
-
159
-
160
-
161
-
162
-
163
-
164
-
165
-
166
-
167
-
168
-
169
-
170
-
171
-
172
-
173
-
174
-
175
-
176
-
177
-
178
-
179
-
180
-
181
-
182
-
183
-
184
-
185
-
186
-
187
-
188
-
189
-
190
-
191
-
192
-
193
-
194
-
195
-
196
-
197
-
198
-
199
-
200
-
201
-
202
 |
 |

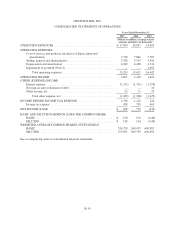
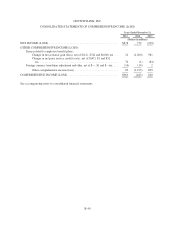
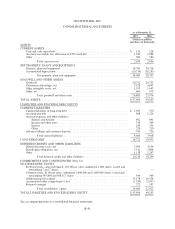
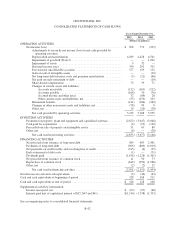
CENTURYLINK, INC.
CONSOLIDATED STATEMENTS OF OPERATIONS
Years Ended December 31,
2015 2014 2013
(Dollars in millions, except per share
amounts and shares in thousands)
OPERATING REVENUES ......................................... $ 17,900 18,031 18,095
OPERATING EXPENSES
Cost of services and products (exclusive of depreciation and
amortization) .............................................. 7,778 7,846 7,507
Selling, general and administrative ............................... 3,328 3,347 3,502
Depreciation and amortization .................................. 4,189 4,428 4,541
Impairment of goodwill (Note 2) ................................ — — 1,092
Total operating expenses ................................... 15,295 15,621 16,642
OPERATING INCOME ........................................... 2,605 2,410 1,453
OTHER (EXPENSE) INCOME
Interest expense .............................................. (1,312) (1,311) (1,298)
Net gain on early retirement of debt .............................. — — 10
Other income, net ............................................ 23 11 59
Total other expense, net .................................... (1,289) (1,300) (1,229)
INCOME BEFORE INCOME TAX EXPENSE ......................... 1,316 1,110 224
Income tax expense ........................................... 438 338 463
NET INCOME (LOSS) ............................................ $ 878 772 (239)
BASIC AND DILUTED EARNINGS (LOSS) PER COMMON SHARE
BASIC ..................................................... $ 1.58 1.36 (0.40)
DILUTED .................................................. $ 1.58 1.36 (0.40)
WEIGHTED AVERAGE COMMON SHARES OUTSTANDING
BASIC ..................................................... 554,278 568,435 600,892
DILUTED .................................................. 555,093 569,739 600,892
See accompanying notes to consolidated financial statements.
B-39