CenturyLink 2015 Annual Report Download - page 116
Download and view the complete annual report
Please find page 116 of the 2015 CenturyLink annual report below. You can navigate through the pages in the report by either clicking on the pages listed below, or by using the keyword search tool below to find specific information within the annual report.-
 1
1 -
2
-
3
-
4
-
5
-
6
-
7
-
8
-
9
-
10
-
11
-
12
-
13
-
14
-
15
-
16
-
17
-
18
-
19
-
20
-
21
-
22
-
23
-
24
-
25
-
26
-
27
-
28
-
29
-
30
-
31
-
32
-
33
-
34
-
35
-
36
-
37
-
38
-
39
-
40
-
41
-
42
-
43
-
44
-
45
-
46
-
47
-
48
-
49
-
50
-
51
-
52
-
53
-
54
-
55
-
56
-
57
-
58
-
59
-
60
-
61
-
62
-
63
-
64
-
65
-
66
-
67
-
68
-
69
-
70
-
71
-
72
-
73
-
74
-
75
-
76
-
77
-
78
-
79
-
80
-
81
-
82
-
83
-
84
-
85
-
86
-
87
-
88
-
89
-
90
-
91
-
92
-
93
-
94
-
95
-
96
-
97
-
98
-
99
-
100
-
101
-
102
-
103
-
104
-
105
-
 106
106 -
 107
107 -
 108
108 -
 109
109 -
 110
110 -
 111
111 -
 112
112 -
 113
113 -
 114
114 -
 115
115 -
 116
116 -
 117
117 -
 118
118 -
 119
119 -
 120
120 -
 121
121 -
 122
122 -
 123
123 -
 124
124 -
 125
125 -
 126
126 -
127
-
128
-
129
-
130
-
131
-
132
-
133
-
134
-
135
-
136
-
137
-
138
-
139
-
140
-
141
-
142
-
143
-
144
-
145
-
146
-
147
-
148
-
149
-
150
-
151
-
152
-
153
-
154
-
155
-
156
-
157
-
158
-
159
-
160
-
161
-
162
-
163
-
164
-
165
-
166
-
167
-
168
-
169
-
170
-
171
-
172
-
173
-
174
-
175
-
176
-
177
-
178
-
179
-
180
-
181
-
182
-
183
-
184
-
185
-
186
-
187
-
188
-
189
-
190
-
191
-
192
-
193
-
194
-
195
-
196
-
197
-
198
-
199
-
200
-
201
-
202
 |
 |

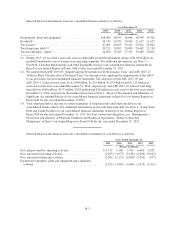
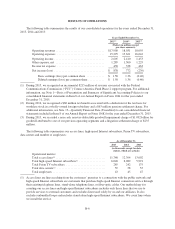
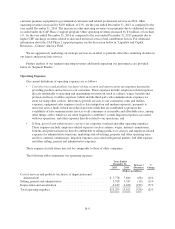
The following tables summarize our consolidated operating revenues recorded under our four revenue
categories:
Years Ended
December 31, Increase /
(Decrease)
%
Change2015 2014
(Dollars in millions)
Strategic services ............................................ $ 9,343 9,166 177 2 %
Legacy services ............................................. 6,752 7,172 (420) (6)%
Data integration ............................................. 573 690 (117) (17)%
Other ...................................................... 1,232 1,003 229 23 %
Total operating revenues ...................................... $17,900 18,031 (131) (1)%
Years Ended
December 31, Increase /
(Decrease)
%
Change2014 2013
(Dollars in millions)
Strategic services ............................................ $ 9,166 8,776 390 4 %
Legacy services ............................................. 7,172 7,663 (491) (6)%
Data integration ............................................. 690 656 34 5%
Other ...................................................... 1,003 1,000 3 — %
Total operating revenues ...................................... $18,031 18,095 (64) — %
During the first quarter of 2015, we determined that certain products and services associated with our
acquisition of SAVVIS, Inc. (“Savvis”) are more closely aligned to legacy services than to strategic services. As
a result, these operating revenues are now reflected as legacy services. The revision resulted in a reduction of
revenue from strategic services of $34 million and $47 million, respectively, and a corresponding increase in
revenue from legacy services for the years ended December 31, 2014 and 2013, respectively.
Our total operating revenues decreased by $131 million, or 1%, for the year ended December 31, 2015 as
compared to the year ended December 31, 2014 and operating revenues decreased by $64 million, or less than
1%, for the year ended December 31, 2014 as compared to the year ended December 31, 2013. The decline in
revenues for both periods was primarily due to lower legacy services revenues, which decreased by $420 million,
or 6%, and $491 million, or 6%, for the respective periods. The decline in legacy services revenues reflects the
continuing loss of access lines and loss of long-distance revenues primarily due to the displacement of traditional
wireline telephone services by other competitive products and services, including Internet and wireless
communication services. At December 31, 2015, we had approximately 11.7 million access lines, or
approximately 5.2% less than the number of access lines we operated at December 31, 2014. At December 31,
2014, we had approximately 12.4 million access lines, or approximately 4.7% less than the number of access
lines we operated at December 31, 2013. We estimate that the rate of our access lines losses will be between
5.0% and 6.0% over the full year of 2016. The growth in our strategic services revenues for both periods was
primarily due to increases in high-speed Internet, Ethernet, MPLS, facilities-based video and IT services and
from rate increases on various services, which were substantially offset by declines in private line (including
special access) services, colocation and hosting services. The level of strategic revenue growth in 2015 was lower
than 2014, primarily driven by revenue declines in hosting products as well as a pricing change for a large
wholesale customer in exchange for a longer term commitment. Data integration revenues, which are typically
more volatile than our other sources of revenues, decreased by $117 million, or 17%, for the year ended
December 31, 2015 as compared to the year ended December 31, 2014. The decline in data integration revenues
was primarily due to declines in governmental sales and professional services, which were partially offset by an
increase in maintenance services. Data integration revenues increased by $34 million, or 5%, for the year ended
December 31, 2014 as compared to the year ended December 31, 2013 primarily due to several large sales of
B-8