CenturyLink 2015 Annual Report Download - page 119
Download and view the complete annual report
Please find page 119 of the 2015 CenturyLink annual report below. You can navigate through the pages in the report by either clicking on the pages listed below, or by using the keyword search tool below to find specific information within the annual report.-
 1
1 -
2
-
3
-
4
-
5
-
6
-
7
-
8
-
9
-
10
-
11
-
12
-
13
-
14
-
15
-
16
-
17
-
18
-
19
-
20
-
21
-
22
-
23
-
24
-
25
-
26
-
27
-
28
-
29
-
30
-
31
-
32
-
33
-
34
-
35
-
36
-
37
-
38
-
39
-
40
-
41
-
42
-
43
-
44
-
45
-
46
-
47
-
48
-
49
-
50
-
51
-
52
-
53
-
54
-
55
-
56
-
57
-
58
-
59
-
60
-
61
-
62
-
63
-
64
-
65
-
66
-
67
-
68
-
69
-
70
-
71
-
72
-
73
-
74
-
75
-
76
-
77
-
78
-
79
-
80
-
81
-
82
-
83
-
84
-
85
-
86
-
87
-
88
-
89
-
90
-
91
-
92
-
93
-
94
-
95
-
96
-
97
-
98
-
99
-
100
-
101
-
102
-
103
-
104
-
105
-
106
-
107
-
108
-
 109
109 -
 110
110 -
 111
111 -
 112
112 -
 113
113 -
 114
114 -
 115
115 -
 116
116 -
 117
117 -
 118
118 -
 119
119 -
 120
120 -
 121
121 -
 122
122 -
 123
123 -
 124
124 -
 125
125 -
 126
126 -
 127
127 -
 128
128 -
 129
129 -
130
-
131
-
132
-
133
-
134
-
135
-
136
-
137
-
138
-
139
-
140
-
141
-
142
-
143
-
144
-
145
-
146
-
147
-
148
-
149
-
150
-
151
-
152
-
153
-
154
-
155
-
156
-
157
-
158
-
159
-
160
-
161
-
162
-
163
-
164
-
165
-
166
-
167
-
168
-
169
-
170
-
171
-
172
-
173
-
174
-
175
-
176
-
177
-
178
-
179
-
180
-
181
-
182
-
183
-
184
-
185
-
186
-
187
-
188
-
189
-
190
-
191
-
192
-
193
-
194
-
195
-
196
-
197
-
198
-
199
-
200
-
201
-
202
 |
 |

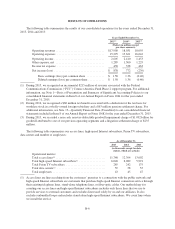
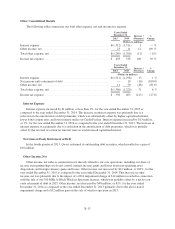
the settlement threshold, therefore settlement accounting was not triggered in 2015. We made cash settlement
payments of approximately $460 million, which triggered settlement accounting and resulted in us recording
additional pension expense of $63 million for the year ended December 31, 2014. Pension expense is allocated to
cost of services and products (exclusive of depreciation and amortization) and to selling, general and
administrative.
Non-recurring Operating Expenses Related to Acquisitions
We have incurred certain non-recurring operating expenses related to our acquisitions since 2009, including
our acquisitions of Qwest in April 2011 and Savvis in July 2011. These expenses are reflected in cost of services
and products and selling, general and administrative expenses in our consolidated statements of operations, as
summarized below.
Years Ended
December 31,
2015 2014 2013
(Dollars in millions)
Cost of services and products:
Integration and other expenses associated with acquisitions ........................ $14 15 15
Total ................................................................... $14 15 15
Selling, general and administrative:
Integration and other expenses associated with acquisitions ........................ $18 36 28
Severance expenses, accelerated recognition of share-based awards and retention
compensation associated with acquisitions ................................... — — 10
Total ................................................................... $18 36 38
Based on current plans and information, we estimate, in relation to our Qwest acquisition, total integration,
severance and retention expenses to be between $600 million to $625 million (which includes approximately
$594 million of cumulative expenses incurred through December 31, 2015) and our capital expenditures
associated with integration activities will approximate $170 million (which includes approximately $144 million
of cumulative capital expenditures incurred through December 31, 2015). We anticipate that the amount of our
integration costs in future years will vary substantially based on integration activities conducted during those
periods and could in certain cases be higher than those incurred by us during the year ended December 31, 2015.
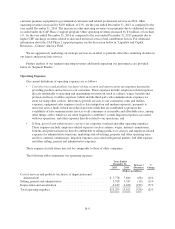
Depreciation and Amortization
The following tables provide detail of our depreciation and amortization expense:
Years Ended
December 31, Increase /
(Decrease)
%
Change2015 2014
(Dollars in millions)
Depreciation .................................................. $2,836 2,958 (122) (4)%
Amortization .................................................. 1,353 1,470 (117) (8)%
Total depreciation and amortization ................................ $4,189 4,428 (239) (5)%
B-11