CenturyLink 2015 Annual Report Download - page 140
Download and view the complete annual report
Please find page 140 of the 2015 CenturyLink annual report below. You can navigate through the pages in the report by either clicking on the pages listed below, or by using the keyword search tool below to find specific information within the annual report.-
 1
1 -
2
-
3
-
4
-
5
-
6
-
7
-
8
-
9
-
10
-
11
-
12
-
13
-
14
-
15
-
16
-
17
-
18
-
19
-
20
-
21
-
22
-
23
-
24
-
25
-
26
-
27
-
28
-
29
-
30
-
31
-
32
-
33
-
34
-
35
-
36
-
37
-
38
-
39
-
40
-
41
-
42
-
43
-
44
-
45
-
46
-
47
-
48
-
49
-
50
-
51
-
52
-
53
-
54
-
55
-
56
-
57
-
58
-
59
-
60
-
61
-
62
-
63
-
64
-
65
-
66
-
67
-
68
-
69
-
70
-
71
-
72
-
73
-
74
-
75
-
76
-
77
-
78
-
79
-
80
-
81
-
82
-
83
-
84
-
85
-
86
-
87
-
88
-
89
-
90
-
91
-
92
-
93
-
94
-
95
-
96
-
97
-
98
-
99
-
100
-
101
-
102
-
103
-
104
-
105
-
106
-
107
-
108
-
109
-
110
-
111
-
112
-
113
-
114
-
115
-
116
-
117
-
118
-
119
-
120
-
121
-
122
-
123
-
124
-
125
-
126
-
127
-
128
-
129
-
 130
130 -
 131
131 -
 132
132 -
 133
133 -
 134
134 -
 135
135 -
 136
136 -
 137
137 -
 138
138 -
 139
139 -
 140
140 -
 141
141 -
 142
142 -
 143
143 -
 144
144 -
 145
145 -
 146
146 -
 147
147 -
 148
148 -
 149
149 -
 150
150 -
151
-
152
-
153
-
154
-
155
-
156
-
157
-
158
-
159
-
160
-
161
-
162
-
163
-
164
-
165
-
166
-
167
-
168
-
169
-
170
-
171
-
172
-
173
-
174
-
175
-
176
-
177
-
178
-
179
-
180
-
181
-
182
-
183
-
184
-
185
-
186
-
187
-
188
-
189
-
190
-
191
-
192
-
193
-
194
-
195
-
196
-
197
-
198
-
199
-
200
-
201
-
202
 |
 |

Historical Information
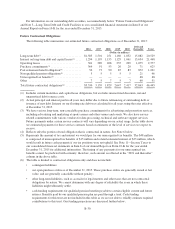
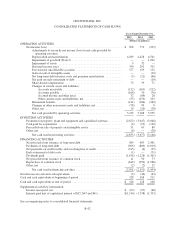
The following tables summarize our consolidated cash flow activities:
Years Ended
December 31, Increase /
(Decrease)2015 2014
(Dollars in millions)
Net cash provided by operating activities .............. $5,152 5,188 (36)
Net cash used in investing activities .................. (2,853) (3,077) (224)
Net cash used in financing activities .................. (2,301) (2,151) 150
Years Ended
December 31, Increase /
(Decrease)2014 2013
(Dollars in millions)
Net cash provided by operating activities .............. $5,188 5,559 (371)
Net cash used in investing activities .................. (3,077) (3,148) (71)
Net cash used in financing activities .................. (2,151) (2,454) (303)
Net cash provided by operating activities decreased by $36 million for the year ended December 31, 2015 as
compared to the year ended December 31, 2014 primarily due to a slight negative variance in net income
adjusted for non-cash items along with negative variances in accounts payable and other noncurrent assets and
liabilities, net. The decreases were substantially offset with positive variances in accrued income and other taxes
and other current assets and liabilities, net, which was primarily due to a payment of approximately $235 million
in 2014 to settle certain litigation. Our net cash provided by operating activities in 2015 was also positively
impacted by the cash received from the CAF Phase 2 support program, which was $209 million greater than the
cash we would have otherwise received during the same period under the interstate USF support program. Net
cash provided by operating activities decreased by $371 million for the year ended December 31, 2014 as
compared to the year ended December 31, 2013 primarily due to a negative variance in net income adjusted for
non-cash items along with a payment of approximately $235 million in the first quarter of 2014 to settle certain
litigation. These decreases were substantially offset by positive variances in the changes in accounts payable and
retirement benefits.
During the year ended December 31, 2015, we made a voluntary cash contribution to the trust of $100
million to fund our qualified pension plan. During the years ended December 31, 2014 and 2013, and prior to the
pension plan merger, we made required cash contributions to the trust of $157 million and $146 million,
respectively, to fund our qualified pension plans.
Net cash used in investing activities decreased by $224 million for the year end December 31, 2015 as
compared to the year ended December 31, 2014 primarily due to a decrease in payments of property, plant and
equipment and amounts paid for acquisitions in 2015. Net cash used in investing activities decreased by $71
million for the year ended December 31, 2014 as compared to the year ended December 31, 2013 primarily due
to less cash paid for acquisitions.
Net cash used in financing activities increased by $150 million for the year ended December 31, 2015 as
compared to the year ended December 31, 2014 primarily due to additional common stock repurchases as the net
debt repayments were approximately the same in both years. Net cash used in financing activities decreased by
$303 million for the year ended December 31, 2014 as compared to the year ended December 31, 2013 primarily
due to reductions in net debt paydowns in 2014 versus net borrowings in 2013 and common stock repurchases.
During the year ended December 31, 2015, we repurchased 27.1 million shares of the company’s
outstanding common stock in the open market. These shares were repurchased for an aggregate market price of
$800 million, or an average purchase price of $29.56 per share. The repurchased common stock has been retired.
B-32