CenturyLink 2015 Annual Report Download - page 111
Download and view the complete annual report
Please find page 111 of the 2015 CenturyLink annual report below. You can navigate through the pages in the report by either clicking on the pages listed below, or by using the keyword search tool below to find specific information within the annual report.-
 1
1 -
2
-
3
-
4
-
5
-
6
-
7
-
8
-
9
-
10
-
11
-
12
-
13
-
14
-
15
-
16
-
17
-
18
-
19
-
20
-
21
-
22
-
23
-
24
-
25
-
26
-
27
-
28
-
29
-
30
-
31
-
32
-
33
-
34
-
35
-
36
-
37
-
38
-
39
-
40
-
41
-
42
-
43
-
44
-
45
-
46
-
47
-
48
-
49
-
50
-
51
-
52
-
53
-
54
-
55
-
56
-
57
-
58
-
59
-
60
-
61
-
62
-
63
-
64
-
65
-
66
-
67
-
68
-
69
-
70
-
71
-
72
-
73
-
74
-
75
-
76
-
77
-
78
-
79
-
80
-
81
-
82
-
83
-
84
-
85
-
86
-
87
-
88
-
89
-
90
-
91
-
92
-
93
-
94
-
95
-
96
-
97
-
98
-
99
-
100
-
 101
101 -
 102
102 -
 103
103 -
 104
104 -
 105
105 -
 106
106 -
 107
107 -
 108
108 -
 109
109 -
 110
110 -
 111
111 -
 112
112 -
 113
113 -
 114
114 -
 115
115 -
 116
116 -
 117
117 -
 118
118 -
 119
119 -
 120
120 -
 121
121 -
122
-
123
-
124
-
125
-
126
-
127
-
128
-
129
-
130
-
131
-
132
-
133
-
134
-
135
-
136
-
137
-
138
-
139
-
140
-
141
-
142
-
143
-
144
-
145
-
146
-
147
-
148
-
149
-
150
-
151
-
152
-
153
-
154
-
155
-
156
-
157
-
158
-
159
-
160
-
161
-
162
-
163
-
164
-
165
-
166
-
167
-
168
-
169
-
170
-
171
-
172
-
173
-
174
-
175
-
176
-
177
-
178
-
179
-
180
-
181
-
182
-
183
-
184
-
185
-
186
-
187
-
188
-
189
-
190
-
191
-
192
-
193
-
194
-
195
-
196
-
197
-
198
-
199
-
200
-
201
-
202
 |
 |

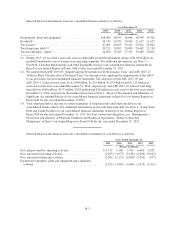
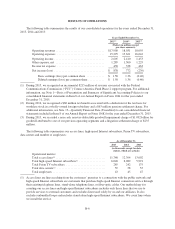
Selected financial information from our consolidated balance sheets is as follows:
As of December 31,
2015 2014 2013 2012 2011
(Dollars in millions)
Net property, plant and equipment ......................... $18,069 18,433 18,646 18,909 19,361
Goodwill(1) ........................................... 20,742 20,755 20,674 21,627 21,627
Total assets(2) ......................................... 47,604 49,103 50,471 52,901 54,842
Total long-term debt(2)(3) ................................. 20,225 20,503 20,809 20,481 21,758
Total stockholders’ equity(1) .............................. 14,060 15,023 17,191 19,289 20,827
(1) During 2013, we recorded a non-cash, non-tax-deductible goodwill impairment charge of $1.092 billion for
goodwill attributed to one of our previous operating segments. For additional information, see Note 2—
Goodwill, Customer Relationships and Other Intangible Assets to our consolidated financial statements in
Item 8 of our Annual Report on Form 10-K for the year ended December 31, 2015.
(2) We adopted both ASU 2015-03 “Simplifying the Presentation of Debt Issuance Costs” and ASU 2015-17
“Balance Sheet Classification of Deferred Taxes” by retrospectively applying the requirements of the ASUs
to our previously issued consolidated financial statements. The adoption of both ASU 2015-03 and
ASU 2015-17 reduced total assets by $1.044 billion, $1.316 billion, $1.039 billion and $1.122 billion in
each year for the four years ended December 31, 2014, respectively, and ASU 2015-03 reduced total long-
term debt by $168 million, $157 million, $124 million and $78 million in each year for the four years ended
December 31, 2014, respectively. See further discussion in Note 1—Basis of Presentation and Summary of
Significant Accounting Policies to our consolidated financial statements in Item 8 of our Annual Report on
Form 10-K for the year ended December 31,2015.
(3) Total long-term debt is the sum of current maturities of long-term debt and long-term debt on our
consolidated balance sheets. For additional information on our total long-term debt, see Note 3—Long-Term
Debt and Credit Facilities to our consolidated financial statements in Item 8 of our Annual Report on
Form 10-K for the year ended December 31, 2015. For total contractual obligations, see “Management’s
Discussion and Analysis of Financial Condition and Results of Operations—Future Contractual
Obligations” in Item 7 our Annual Report on Form 10-K for the year ended December 31, 2015.
Selected financial information from our consolidated statements of cash flows is as follows:
Years Ended December 31,
2015 2014 2013 2012 2011
(Dollars in millions)
Net cash provided by operating activities ..................... $5,152 5,188 5,559 6,065 4,201
Net cash used in investing activities ......................... (2,853) (3,077) (3,148) (2,690) (3,647)
Net cash used in financing activities ......................... (2,301) (2,151) (2,454) (3,295) (577)
Payments for property, plant and equipment and capitalized
software ............................................. (2,872) (3,047) (3,048) (2,919) (2,411)
B-3