CarMax 2016 Annual Report Download - page 69
Download and view the complete annual report
Please find page 69 of the 2016 CarMax annual report below. You can navigate through the pages in the report by either clicking on the pages listed below, or by using the keyword search tool below to find specific information within the annual report.-
 1
1 -
2
-
3
-
4
-
5
-
6
-
7
-
8
-
9
-
10
-
11
-
12
-
13
-
14
-
15
-
16
-
17
-
18
-
19
-
20
-
21
-
22
-
23
-
24
-
25
-
26
-
27
-
28
-
29
-
30
-
31
-
32
-
33
-
34
-
35
-
36
-
37
-
38
-
39
-
40
-
41
-
42
-
43
-
44
-
45
-
46
-
47
-
48
-
49
-
50
-
51
-
52
-
53
-
54
-
55
-
56
-
57
-
58
-
 59
59 -
 60
60 -
 61
61 -
 62
62 -
 63
63 -
 64
64 -
 65
65 -
 66
66 -
 67
67 -
 68
68 -
 69
69 -
 70
70 -
 71
71 -
 72
72 -
 73
73 -
 74
74 -
 75
75 -
 76
76 -
 77
77 -
 78
78 -
 79
79 -
80
-
81
-
82
-
83
-
84
-
85
-
86
-
87
-
88
 |
 |

65
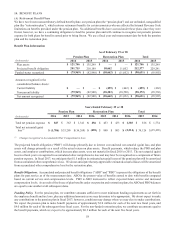
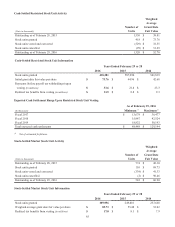
Cash-Settled Restricted Stock Unit Activity
Weighted
Average
Number of Grant Date
(Units in thousands) Units Fair Value
Outstanding as of February 28, 2015 1,530 $ 39.81
Stock units granted 418 $ 73.76
Stock units vested and converted (529) $ 32.35
Stock units cancelled (99) $ 51.29
Outstanding as of February 29, 2016 1,320 $ 52.70
Cash-Settled Restricted Stock Unit Information
Years Ended February 29 or 28
2016 2015 2014
Stock units granted 418,281 587,990 541,819
Initial grant date fair value per share $ 73.76 $ 44.96 $ 42.68
Payments (before payroll tax withholdings) upon
vesting (in millions) $ 33.6 $ 21.8 $ 23.3
Realized tax benefits from vesting (in millions) $ 13.5 $ 8.8 $ 9.3
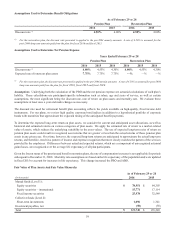
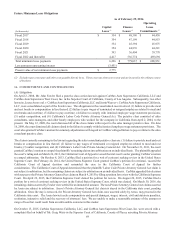
Expected Cash Settlement Range Upon Restricted Stock Unit Vesting
As of February 29, 2016
(In thousands) Minimum (1) Maximum (1)
Fiscal 2017 $ 13,679 $ 36,477
Fiscal 2018 15,947 42,524
Fiscal 2019 18,822 50,193
Total expected cash settlements $ 48,448 $ 129,194
(1) Net of estimated forfeitures.
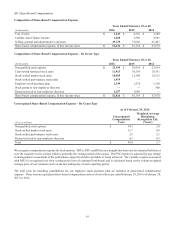
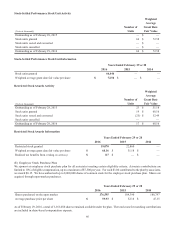
Stock-Settled Market Stock Unit Activity
Weighted
Average
Number of Grant Date
(Units in thousands) Units Fair Value
Outstanding as of February 28, 2015 774 $ 48.30
Stock units granted 110 $ 89.73
Stock units vested and converted (339) $ 41.33
Stock units cancelled (2) $ 90.46
Outstanding as of February 29, 2016 543 $ 60.90
Stock-Settled Market Stock Unit Information
Years Ended February 29 or 28
2016 2015 2014
Stock units granted 109,956 249,801 237,660
Weighted average grant date fair value per share $ 89.73 $ 55.48 $ 52.02
Realized tax benefits from vesting (in millions) $ 17.0 $ 8.1 $ 7.9