CarMax 2016 Annual Report Download - page 33
Download and view the complete annual report
Please find page 33 of the 2016 CarMax annual report below. You can navigate through the pages in the report by either clicking on the pages listed below, or by using the keyword search tool below to find specific information within the annual report.-
 1
1 -
2
-
3
-
4
-
5
-
6
-
7
-
8
-
9
-
10
-
11
-
12
-
13
-
14
-
15
-
16
-
17
-
18
-
19
-
20
-
21
-
22
-
 23
23 -
 24
24 -
 25
25 -
 26
26 -
 27
27 -
 28
28 -
 29
29 -
 30
30 -
 31
31 -
 32
32 -
 33
33 -
 34
34 -
 35
35 -
 36
36 -
 37
37 -
 38
38 -
 39
39 -
 40
40 -
 41
41 -
 42
42 -
 43
43 -
44
-
45
-
46
-
47
-
48
-
49
-
50
-
51
-
52
-
53
-
54
-
55
-
56
-
57
-
58
-
59
-
60
-
61
-
62
-
63
-
64
-
65
-
66
-
67
-
68
-
69
-
70
-
71
-
72
-
73
-
74
-
75
-
76
-
77
-
78
-
79
-
80
-
81
-
82
-
83
-
84
-
85
-
86
-
87
-
88
 |
 |

29
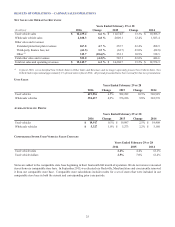
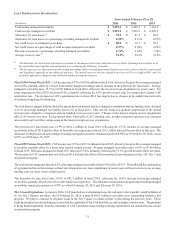
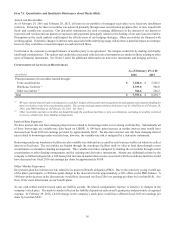
Selling, General and Administrative (“SG&A”) Expenses
COMPONENTS OF SG&A EXPENSES
Years Ended February 29 or 28
(In millions except per unit data) 2016 Change 2015 Change 2014
Compensation and benefits (1) $ 737.6 1.0% $ 730.4 11.2 % $ 656.7
Store occupancy costs 275.6 13.2% 243.5 12.3 % 216.8
Advertising expense 140.6 14.5% 122.8 9.4 % 112.2
Other overhead costs (2) 198.1 23.0% 161.0 (5.0)% 169.5
Total SG&A expenses $ 1,351.9 7.5% $ 1,257.7 8.9 % $ 1,155.2
SG&A per used vehicle unit (3) $ 2,181 $ 21 $ 2,160 $ (32) $ 2,192
(1) Excludes compensation and benefits related to reconditioning and vehicle repair service, which are included in cost of sales.
(2) Includes IT expenses, insurance, non-CAF bad debt, travel, preopening and relocation costs, charitable contributions and other
administrative expenses. Costs for fiscal 2015 were reduced by $20.9 million in connection with the receipt of settlement proceeds in a class
action lawsuit.
(3) Calculated as total SG&A expenses divided by total used vehicle units.
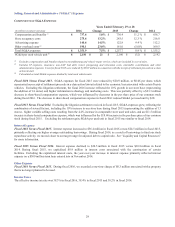
Fiscal 2016 Versus Fiscal 2015. SG&A expenses for fiscal 2015 were reduced by $20.9 million, or $0.06 per share, which
represented our receipt of settlement proceeds in a class action lawsuit related to the economic loss associated with certain Toyota
vehicles. Excluding this litigation settlement, the fiscal 2016 increase reflected the 10% growth in our store base (representing
the addition of 14 stores) and higher information technology and marketing costs. This was partially offset by a $23.3 million
decrease in share-based compensation expense, which was influenced by decreases in the per share price of our common stock
during fiscal 2016. The decrease in share-based compensation expense in fiscal 2016 reduced SG&A per used unit by $38.
Fiscal 2015 Versus Fiscal 2014. Excluding the litigation settlement received in fiscal 2015, SG&A expenses grew, reflecting the
combination of several factors, including the 10% increase in our store base during fiscal 2015 (representing the addition of 13
stores), higher variable selling costs resulting from the 4.4% increase in comparable store used unit sales, and an $11.5 million
increase in share-based compensation expense, which was influenced by the $18.68 increase in the per share price of our common
stock during fiscal 2015. Excluding the settlement gain, SG&A per used unit in fiscal 2015 was similar to fiscal 2014.
Interest Expense
Fiscal 2016 Versus Fiscal 2015. Interest expense increased to $36.4 million in fiscal 2016 versus $24.5 million in fiscal 2015,
primarily reflecting our higher average outstanding borrowings. During fiscal 2016, as a result of borrowings to fund our stock
repurchase activity, we moved closer to our target range for adjusted debt to capital ratio. See “Liquidity and Capital Resources”
for more information.
Fiscal 2015 Versus Fiscal 2014. Interest expense declined to $24.5 million in fiscal 2015 versus $30.8 million in fiscal
2014. During fiscal 2015, we capitalized $8.9 million in interest costs associated with the construction of certain
facilities. Excluding the capitalized interest costs, the year-over-year increase in interest expense primarily reflected interest
expense on a $300 million term loan entered into in November 2014.
Other Expense
Fiscal 2016 Versus Fiscal 2015. During fiscal 2016, we recorded a one-time charge of $8.3 million associated with a property
that is no longer planned to be used.
Income Taxes
The effective income tax rate was 38.3% in fiscal 2016, 38.4% in fiscal 2015 and 38.2% in fiscal 2014.