CarMax 2016 Annual Report Download - page 55
Download and view the complete annual report
Please find page 55 of the 2016 CarMax annual report below. You can navigate through the pages in the report by either clicking on the pages listed below, or by using the keyword search tool below to find specific information within the annual report.-
 1
1 -
2
-
3
-
4
-
5
-
6
-
7
-
8
-
9
-
10
-
11
-
12
-
13
-
14
-
15
-
16
-
17
-
18
-
19
-
20
-
21
-
22
-
23
-
24
-
25
-
26
-
27
-
28
-
29
-
30
-
31
-
32
-
33
-
34
-
35
-
36
-
37
-
38
-
39
-
40
-
41
-
42
-
43
-
44
-
 45
45 -
 46
46 -
 47
47 -
 48
48 -
 49
49 -
 50
50 -
 51
51 -
 52
52 -
 53
53 -
 54
54 -
 55
55 -
 56
56 -
 57
57 -
 58
58 -
 59
59 -
 60
60 -
 61
61 -
 62
62 -
 63
63 -
 64
64 -
 65
65 -
66
-
67
-
68
-
69
-
70
-
71
-
72
-
73
-
74
-
75
-
76
-
77
-
78
-
79
-
80
-
81
-
82
-
83
-
84
-
85
-
86
-
87
-
88
 |
 |
51
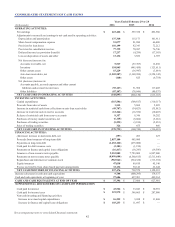
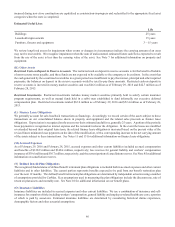
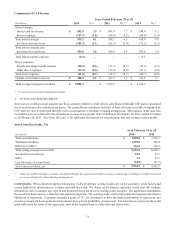
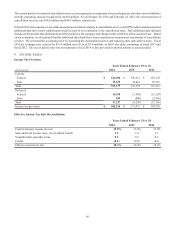
Components of CAF Income
Years Ended February 29 or 28
(In millions) 2016 % (1) 2015 % (1) 2014 % (1)
Interest margin:
Interest and fee income $ 682.9 7.5 $ 604.9 7.7 $ 548.0 8.3
Interest expense (127.7) (1.4)(96.6)(1.2)(90.0)(1.4)
Total interest margin 555.2 6.1 508.3 6.5 458.0 6.9
Provision for loan losses (101.2) (1.1)(82.3)(1.0)(72.2)(1.1)
Total interest margin after
provision for loan losses 454.0 5.0 426.0 5.4 385.8 5.8
Total other (expense) income (0.4) — — — 0.1 —
Direct expenses:
Payroll and fringe benefit expense (28.2) (0.3)(25.3)(0.3)(22.6)(0.3)
Other direct expenses (33.4) (0.4)(33.4)(0.4)(27.1)(0.4)
Total direct expenses (61.6) (0.7)(58.7)(0.7)(49.7)(0.8)
CarMax Auto Finance income $ 392.0 4.3 $ 367.3 4.7 $ 336.2 5.1
Total average managed receivables $ 9,092.9 $ 7,859.9 $ 6,629.5
(1) Percent of total average managed receivables.
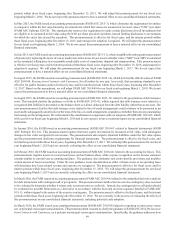
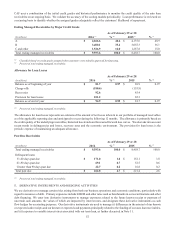
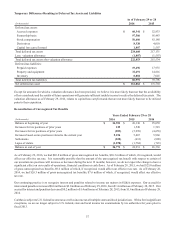
4. AUTO LOAN RECEIVABLES
Auto loan receivables include amounts due from customers related to retail vehicle sales financed through CAF and are presented
net of an allowance for estimated loan losses. We generally use warehouse facilities to fund auto loan receivables originated by
CAF until we elect to fund them through a term securitization or alternative funding arrangement. The majority of the auto loan
receivables serve as collateral for the related non-recourse notes payable of $9.53 billion as of February 29, 2016, and $8.47 billion
as of February 28, 2015. See Notes 2(F) and 11 for additional information on securitizations and non-recourse notes payable.
Auto Loans Receivable, Net
As of February 29 or 28
(In millions) 2016 2015
Term securitizations $ 7,828.0 $ 7,226.5
Warehouse facilities 1,399.0 986.0
Other receivables (1) 366.6 246.2
Total ending managed receivables 9,593.6 8,458.7
Accrued interest and fees 35.0 31.2
Other 3.2 27.3
Less allowance for loan losses (94.9)(81.7)
Auto loan receivables, net $ 9,536.9 $ 8,435.5
(1) Other receivables includes receivables not funded through the warehouse facilities or term securitizations, including receivables restricted
as excess collateral for those funding arrangements.
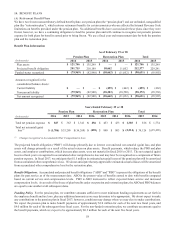
Credit Quality. When customers apply for financing, CAF’s proprietary scoring models rely on the customers’ credit history and
certain application information to evaluate and rank their risk. We obtain credit histories and other credit data that includes
information such as number, age, type of and payment history for prior or existing credit accounts. The application information
that is used includes income, collateral value and down payment. The scoring models yield credit grades that represent the relative
likelihood of repayment. Customers assigned a grade of “A” are determined to have the highest probability of repayment, and
customers assigned a lower grade are determined to have a lower probability of repayment. For loans that are approved, the credit
grade influences the terms of the agreement, such as the required loan-to-value ratio and interest rate.