CarMax 2016 Annual Report Download - page 34
Download and view the complete annual report
Please find page 34 of the 2016 CarMax annual report below. You can navigate through the pages in the report by either clicking on the pages listed below, or by using the keyword search tool below to find specific information within the annual report.-
 1
1 -
2
-
3
-
4
-
5
-
6
-
7
-
8
-
9
-
10
-
11
-
12
-
13
-
14
-
15
-
16
-
17
-
18
-
19
-
20
-
21
-
22
-
23
-
 24
24 -
 25
25 -
 26
26 -
 27
27 -
 28
28 -
 29
29 -
 30
30 -
 31
31 -
 32
32 -
 33
33 -
 34
34 -
 35
35 -
 36
36 -
 37
37 -
 38
38 -
 39
39 -
 40
40 -
 41
41 -
 42
42 -
 43
43 -
 44
44 -
45
-
46
-
47
-
48
-
49
-
50
-
51
-
52
-
53
-
54
-
55
-
56
-
57
-
58
-
59
-
60
-
61
-
62
-
63
-
64
-
65
-
66
-
67
-
68
-
69
-
70
-
71
-
72
-
73
-
74
-
75
-
76
-
77
-
78
-
79
-
80
-
81
-
82
-
83
-
84
-
85
-
86
-
87
-
88
 |
 |

30
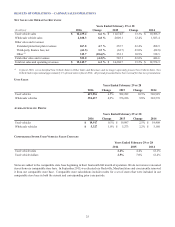
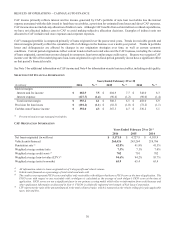
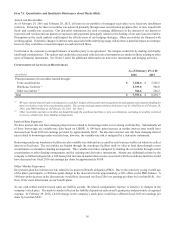
RESULTS OF OPERATIONS – CARMAX AUTO FINANCE
CAF income primarily reflects interest and fee income generated by CAF’s portfolio of auto loan receivables less the interest
expense associated with the debt issued to fund these receivables, a provision for estimated loan losses and direct CAF expenses.
CAF income does not include any allocation of indirect costs. Although CAF benefits from certain indirect overhead expenditures,
we have not allocated indirect costs to CAF to avoid making subjective allocation decisions. Examples of indirect costs not
allocated to CAF include retail store expenses and corporate expenses.
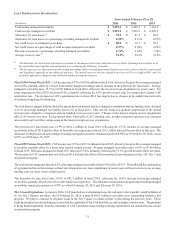
CAF’s managed portfolio is composed primarily of loans originated over the past several years. Trends in receivable growth and
interest margins primarily reflect the cumulative effect of changes in the business over a multi-year period. Trends in portfolio
losses and delinquencies are affected by changes in our origination strategies over time, as well as current economic
conditions. Current period originations reflect current trends in both our retail sales and the CAF business, including the volume
of loans originated, current interest rates charged to consumers, loan terms and average credit scores. Because we recognize CAF
income over the life of the underlying auto loan, loans originated in a given fiscal period generally do not have a significant effect
on that period’s financial results.
See Note 3 for additional information on CAF income and Note 4 for information on auto loan receivables, including credit quality.
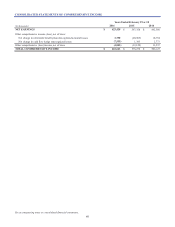
SELECTED CAF FINANCIAL INFORMATION
Years Ended February 29 or 28
(In millions) 2016 % (1) 2015 % (1) 2014 % (1)
Interest margin:
Interest and fee income $ 682.9 7.5 $ 604.9 7.7 $ 548.0 8.3
Interest expense (127.7) (1.4)(96.6)(1.2)(90.0)(1.4)
Total interest margin $ 555.2 6.1 $ 508.3 6.5 $ 458.0 6.9
Provision for loan losses $ (101.2) (1.1)$(82.3)(1.0) $ (72.2)(1.1)
CarMax Auto Finance income $ 392.0 4.3 $ 367.3 4.7 $ 336.2 5.1
(1) Percent of total average managed receivables.
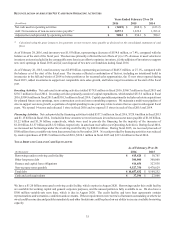
CAF ORIGINATION INFORMATION
Years Ended February 29 or 28 (1)
2016 2015 2014
Net loans originated (in millions) $ 5,171.0 $ 4,727.8 $ 4,183.9
Vehicle units financed 265,426 243,264 218,706
Penetration rate (2) 42.8% 41.8% 41.5%
Weighted average contract rate 7.3% 7.1% 7.0%
Weighted average credit score (3) 702 701 702
Weighted average loan-to-value (LTV) (4) 94.6% 94.2% 93.7%
Weighted average term (in months) 65.9 65.4 65.4
(1) All information relates to loans originated net of 3-day payoffs and vehicle returns.
(2) Vehicle units financed as a percentage of total retail used units sold.
(3) The credit scores represent FICO scores and reflect only receivables with obligors that have a FICO score at the time of application. The
FICO score with respect to any receivable with co-obligors is calculated as the average of each obligor’s FICO score at the time of
application. FICO scores are not a significant factor in our primary scoring model which relies on information from credit bureaus and
other application information as discussed in Note 4. FICO® is a federally registered servicemark of Fair Isaac Corporation.
(4) LTV represents the ratio of the amount financed to the total collateral value, which is measured as the vehicle selling price plus applicable
taxes, title and fees.