CarMax 2016 Annual Report Download - page 56
Download and view the complete annual report
Please find page 56 of the 2016 CarMax annual report below. You can navigate through the pages in the report by either clicking on the pages listed below, or by using the keyword search tool below to find specific information within the annual report.-
 1
1 -
2
-
3
-
4
-
5
-
6
-
7
-
8
-
9
-
10
-
11
-
12
-
13
-
14
-
15
-
16
-
17
-
18
-
19
-
20
-
21
-
22
-
23
-
24
-
25
-
26
-
27
-
28
-
29
-
30
-
31
-
32
-
33
-
34
-
35
-
36
-
37
-
38
-
39
-
40
-
41
-
42
-
43
-
44
-
45
-
 46
46 -
 47
47 -
 48
48 -
 49
49 -
 50
50 -
 51
51 -
 52
52 -
 53
53 -
 54
54 -
 55
55 -
 56
56 -
 57
57 -
 58
58 -
 59
59 -
 60
60 -
 61
61 -
 62
62 -
 63
63 -
 64
64 -
 65
65 -
 66
66 -
67
-
68
-
69
-
70
-
71
-
72
-
73
-
74
-
75
-
76
-
77
-
78
-
79
-
80
-
81
-
82
-
83
-
84
-
85
-
86
-
87
-
88
 |
 |

52
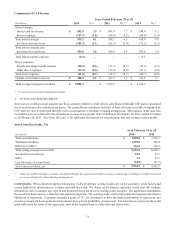
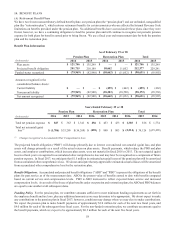
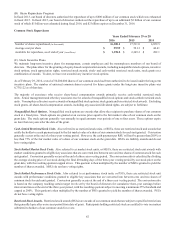
CAF uses a combination of the initial credit grades and historical performance to monitor the credit quality of the auto loan
receivables on an ongoing basis. We validate the accuracy of the scoring models periodically. Loan performance is reviewed on
a recurring basis to identify whether the assigned grades adequately reflect the customers’ likelihood of repayment.
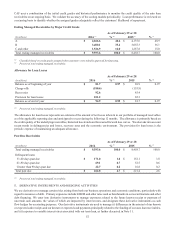
Ending Managed Receivables by Major Credit Grade
As of February 29 or 28
(In millions) 2016 (1) % (2)2015 (1) % (2)
A$ 4,666.6 48.6 $ 4,135.6 48.9
B3,400.1 35.4 3,055.3 36.1
C and other 1,526.9 16.0 1,267.8 15.0
Total ending managed receivables $ 9,593.6 100.0 $ 8,458.7 100.0
(1) Classified based on credit grade assigned when customers were initially approved for financing.
(2) Percent of total ending managed receivables.
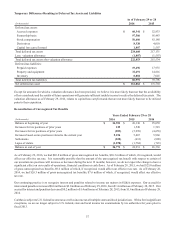
Allowance for Loan Losses
As of February 29 or 28
(In millions) 2016 % (1)2015 % (1)
Balance as of beginning of year $ 81.7 0.97 $ 69.9 0.97
Charge-offs (180.6) (155.9)
Recoveries 92.6 85.4
Provision for loan losses 101.2 82.3
Balance as of end of year $ 94.9 0.99 $ 81.7 0.97
(1) Percent of total ending managed receivables.
The allowance for loan losses represents an estimate of the amount of net losses inherent in our portfolio of managed receivables
as of the applicable reporting date and anticipated to occur during the following 12 months. The allowance is primarily based on
the credit quality of the underlying receivables, historical loss trends and forecasted forward loss curves. We also take into account
recent trends in delinquencies and losses, recovery rates and the economic environment. The provision for loan losses is the
periodic expense of maintaining an adequate allowance.
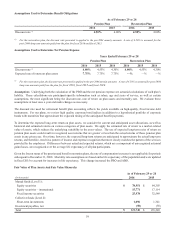
Past Due Receivables
As of February 29 or 28
(In millions) 2016 % (1)2015 % (1)
Total ending managed receivables $ 9,593.6 100.0 $ 8,458.7 100.0
Delinquent loans:
31-60 days past due $ 171.0 1.8 $ 152.1 1.8
61-90 days past due 69.1 0.7 52.5 0.6
Greater than 90 days past due 22.7 0.2 16.8 0.2
Total past due $ 262.8 2.7 $ 221.4 2.6
(1) Percent of total ending managed receivables.
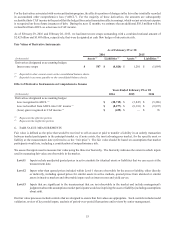
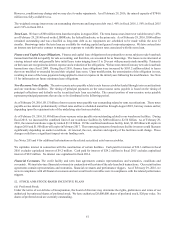
5. DERIVATIVE INSTRUMENTS AND HEDGING ACTIVITIES
We use derivatives to manage certain risks arising from both our business operations and economic conditions, particularly with
regard to issuances of debt. Primary exposures include LIBOR and other rates used as benchmarks in our securitizations and other
debt financing. We enter into derivative instruments to manage exposures related to the future known receipt or payment of
uncertain cash amounts, the values of which are impacted by interest rates, and designate these derivative instruments as cash
flow hedges for accounting purposes. Our derivative instruments are used to manage (i) differences in the amount of our known
or expected cash receipts and our known or expected cash payments principally related to the funding of our auto loan receivables,
and (ii) exposure to variable interest rates associated with our term loan, as further discussed in Note 11.