CarMax 2016 Annual Report Download - page 29
Download and view the complete annual report
Please find page 29 of the 2016 CarMax annual report below. You can navigate through the pages in the report by either clicking on the pages listed below, or by using the keyword search tool below to find specific information within the annual report.-
 1
1 -
2
-
3
-
4
-
5
-
6
-
7
-
8
-
9
-
10
-
11
-
12
-
13
-
14
-
15
-
16
-
17
-
18
-
 19
19 -
 20
20 -
 21
21 -
 22
22 -
 23
23 -
 24
24 -
 25
25 -
 26
26 -
 27
27 -
 28
28 -
 29
29 -
 30
30 -
 31
31 -
 32
32 -
 33
33 -
 34
34 -
 35
35 -
 36
36 -
 37
37 -
 38
38 -
 39
39 -
40
-
41
-
42
-
43
-
44
-
45
-
46
-
47
-
48
-
49
-
50
-
51
-
52
-
53
-
54
-
55
-
56
-
57
-
58
-
59
-
60
-
61
-
62
-
63
-
64
-
65
-
66
-
67
-
68
-
69
-
70
-
71
-
72
-
73
-
74
-
75
-
76
-
77
-
78
-
79
-
80
-
81
-
82
-
83
-
84
-
85
-
86
-
87
-
88
 |
 |
25
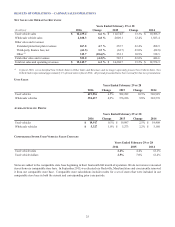
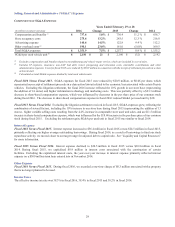
RESULTS OF OPERATIONS – CARMAX SALES OPERATIONS
NET SALES AND OPERATING REVENUES
Years Ended February 29 or 28
(In millions) 2016 Change 2015 Change 2014
Used vehicle sales $ 12,439.4 6.6 % $ 11,674.5 13.3% $ 10,306.3
Wholesale vehicle sales 2,188.3 6.8 % 2,049.1 12.4% 1,823.4
Other sales and revenues:
Extended protection plan revenues 267.8 4.7 % 255.7 22.4% 208.9
Third-party finance fees, net (61.5) 3.5 % (63.7) 23.0% (82.8)
Other (1) 315.7 (10.6)% 353.1 10.9% 318.5
Total other sales and revenues 522.0 (4.2)% 545.1 22.6% 444.6
Total net sales and operating revenues $ 15,149.7 6.2 % $ 14,268.7 13.5% $ 12,574.3
(1) In fiscal 2016, we reclassified New Vehicle Sales to Other Sales and Revenues and no longer separately present New Vehicle Sales. New
Vehicle Sales represented approximately 1% of total sales in fiscal 2016. All periods presented have been revised for this new presentation.
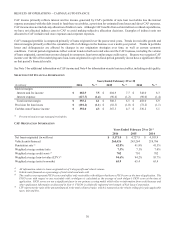
UNIT SALES
Years Ended February 29 or 28
2016 Change 2015 Change 2014
Used vehicles 619,936 6.5% 582,282 10.5% 526,929
Wholesale vehicles 394,437 4.9% 376,186 9.8% 342,576
AVERAGE SELLING PRICES
Years Ended February 29 or 28
2016 Change 2015 Change 2014
Used vehicles $ 19,917 0.1% $ 19,897 2.5% $ 19,408
Wholesale vehicles $ 5,327 1.0% $ 5,273 2.2% $ 5,160
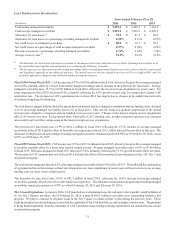
COMPARABLE STORE USED VEHICLE SALES CHANGES
Years Ended February 29 or 28
2016 2015 2014
Used vehicle units 2.4% 4.4% 12.2%
Used vehicle dollars 2.5% 7.0% 12.4%
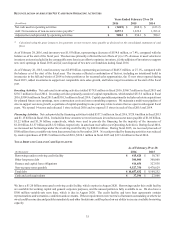
Stores are added to the comparable store base beginning in their fourteenth full month of operation. We do not remove renovated
stores from our comparable store base. In September 2015, we relocated our Rockville, Maryland store and concurrently removed
it from our comparable store base. Comparable store calculations include results for a set of stores that were included in our
comparable store base in both the current and corresponding prior year periods.