CarMax 2016 Annual Report Download - page 35
Download and view the complete annual report
Please find page 35 of the 2016 CarMax annual report below. You can navigate through the pages in the report by either clicking on the pages listed below, or by using the keyword search tool below to find specific information within the annual report.-
 1
1 -
2
-
3
-
4
-
5
-
6
-
7
-
8
-
9
-
10
-
11
-
12
-
13
-
14
-
15
-
16
-
17
-
18
-
19
-
20
-
21
-
22
-
23
-
24
-
 25
25 -
 26
26 -
 27
27 -
 28
28 -
 29
29 -
 30
30 -
 31
31 -
 32
32 -
 33
33 -
 34
34 -
 35
35 -
 36
36 -
 37
37 -
 38
38 -
 39
39 -
 40
40 -
 41
41 -
 42
42 -
 43
43 -
 44
44 -
 45
45 -
46
-
47
-
48
-
49
-
50
-
51
-
52
-
53
-
54
-
55
-
56
-
57
-
58
-
59
-
60
-
61
-
62
-
63
-
64
-
65
-
66
-
67
-
68
-
69
-
70
-
71
-
72
-
73
-
74
-
75
-
76
-
77
-
78
-
79
-
80
-
81
-
82
-
83
-
84
-
85
-
86
-
87
-
88
 |
 |

31
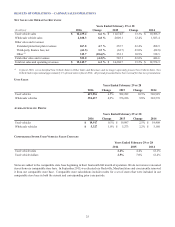
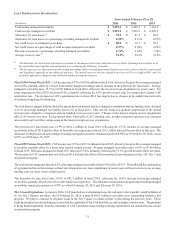
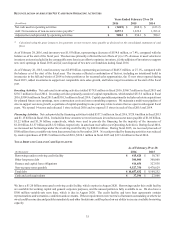
LOAN PERFORMANCE INFORMATION
Years Ended February 29 or 28
(In millions) 2016 2015 2014
Total ending managed receivables $ 9,593.6 $ 8,458.7 $ 7,184.4
Total average managed receivables $ 9,092.9 $ 7,859.9 $ 6,629.5
Allowance for loan losses (1) $ 94.9 $ 81.7 $ 69.9
Allowance for loan losses as a percentage of ending managed receivables 0.99% 0.97% 0.97%
Net credit losses on managed receivables $ 88.0 $ 70.5 $ 59.6
Net credit losses as a percentage of total average managed receivables 0.97% 0.90% 0.90%
Past due accounts as a percentage of ending managed receivables 2.74% 2.62% 2.58%
Average recovery rate (2) 51.2% 54.2% 55.2%
(1) The allowance for loan losses represents an estimate of the amount of net losses inherent in our portfolio of managed receivables as of
the applicable reporting date and anticipated to occur during the following 12 months.
(2) The average recovery rate represents the average percentage of the outstanding principal balance we receive when a vehicle is repossessed
and liquidated, generally at our wholesale auctions. The annual recovery rate has ranged from a low of 42% to a high of 60%, and it is
primarily affected by changes in the wholesale market pricing environment.
Fiscal 2016 Versus Fiscal 2015. CAF income rose 6.7% to $392.0 million in fiscal 2016, driven by the growth in average managed
receivables, partially offset by a lower total interest margin percentage and an increase in the provision for loan losses. Average
managed receivables grew 15.7% to $9.09 billion in fiscal 2016, driven by the rise in net loan originations in recent years. Net
loans originated in fiscal 2016 increased 9.4%, primarily reflecting the 6.6% growth in used vehicle revenues and a higher CAF
penetration rate. The increase in CAF’s penetration rate in fiscal 2016 was largely due to changes in the underlying credit mix
of customers applying for financing.
The total interest margin, which reflects the spread between interest and fees charged to consumers and our funding costs, declined
to 6.1% of average managed receivables from 6.5% in fiscal 2015. This was the result of a gradual compression of the spread
between rates charged to consumers and our funding costs in recent years. Changes in the interest margin on new originations
affect CAF income over time. Rising interest rates, which affect CAF’s funding costs, or other competitive pressures on consumer
rates could result in further compression in the interest margin on new originations.
The provision for loan losses rose 22.9% to $101.2 million in fiscal 2016, reflecting the 15.7% increase in average managed
receivables in fiscal 2016 and the effect of favorable loss experience in fiscal 2015, which reduced the provision in that year. The
allowance for loan losses as a percentage of ending managed receivables remained similar at 0.99% as of February 29, 2016, versus
0.97% as of February 28, 2015.
Fiscal 2015 Versus Fiscal 2014. CAF income rose 9.3% to $367.3 million in fiscal 2015, driven by the growth in average managed
receivables, partially offset by a lower total interest margin percent. Average managed receivables grew 18.6% to $7.86 billion
in fiscal 2015. Net loans originated in fiscal 2015 increased 13.0%, primarily reflecting the 13.3% growth in used vehicle revenues.
The increase in CAF’s penetration rate in fiscal 2015 included the effect of the increase in loans originated in the CAF Tier 3 loan
origination program.
The total interest margin declined to 6.5% of average managed receivables from 6.9% in fiscal 2014. This reflected the combination
of a gradual decline in the average contract rate charged on new loan originations in recent years with an increase in our average
funding costs for more recent securitizations.
The provision for loan losses rose 14.0% to $82.3 million in fiscal 2015, reflecting the 18.6% increase in average managed
receivables, partially offset by the effect of favorable loss experience. The allowance for loan losses as a percent of ending managed
receivables remained consistent at 0.97% as of both February 28, 2015 and February 28, 2014.
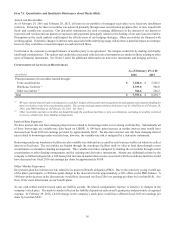
Tier 3 Loan Originations. In January 2014, CAF launched a test originating loans for customers who typically would be financed
by our Tier 3 finance providers. As of February 29, 2016, a total of $96.5 million receivables were outstanding related to this
program. We plan to continue to originate loans in the Tier 3 space at a share similar to that during the past two years. These
loans have higher loss and delinquency rates than the remainder of the CAF portfolio, as well as higher contract rates. The program
is being funded separately from the remainder of CAF’s portfolio using existing working capital and is not included in our current
securitization program.