CarMax 2016 Annual Report Download - page 46
Download and view the complete annual report
Please find page 46 of the 2016 CarMax annual report below. You can navigate through the pages in the report by either clicking on the pages listed below, or by using the keyword search tool below to find specific information within the annual report.-
 1
1 -
2
-
3
-
4
-
5
-
6
-
7
-
8
-
9
-
10
-
11
-
12
-
13
-
14
-
15
-
16
-
17
-
18
-
19
-
20
-
21
-
22
-
23
-
24
-
25
-
26
-
27
-
28
-
29
-
30
-
31
-
32
-
33
-
34
-
35
-
 36
36 -
 37
37 -
 38
38 -
 39
39 -
 40
40 -
 41
41 -
 42
42 -
 43
43 -
 44
44 -
 45
45 -
 46
46 -
 47
47 -
 48
48 -
 49
49 -
 50
50 -
 51
51 -
 52
52 -
 53
53 -
 54
54 -
 55
55 -
 56
56 -
57
-
58
-
59
-
60
-
61
-
62
-
63
-
64
-
65
-
66
-
67
-
68
-
69
-
70
-
71
-
72
-
73
-
74
-
75
-
76
-
77
-
78
-
79
-
80
-
81
-
82
-
83
-
84
-
85
-
86
-
87
-
88
 |
 |

42
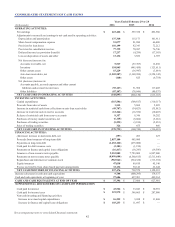
CONSOLIDATED STATEMENTS OF CASH FLOWS
\
Years Ended February 29 or 28
(In thousands) 2016 2015 2014
OPERATING ACTIVITIES:
Net earnings $ 623,428 $ 597,358 $ 492,586
Adjustments to reconcile net earnings to net cash used in operating activities:
Depreciation and amortization 137,360 115,173 101,911
Share-based compensation expense 51,077 81,880 66,480
Provision for loan losses 101,199 82,343 72,212
Provision for cancellation reserves 77,118 70,987 76,746
Deferred income tax provision (benefit) 17,237 (4,299) (17,185)
Loss on disposition of assets and other 13,136 3,852 2,707
Net decrease (increase) in:
Accounts receivable, net 5,519 (57,767) 12,038
Inventory 154,845 (445,450) (123,611)
Other current assets 15,229 (16,947) (3,019)
Auto loan receivables, net (1,202,587) (1,369,999) (1,324,142)
Other assets (160) 825 (6,754)
Net (decrease) increase in:
Accounts payable, accrued expenses and other current
liabilities and accrued income taxes (55,187) 51,960 117,405
Other liabilities (87,107) (78,046) (80,537)
NET CASH USED IN OPERATING ACTIVITIES (148,893) (968,130) (613,163)
INVESTING ACTIVITIES:
Capital expenditures (315,584) (309,817) (310,317)
Proceeds from sales of assets 1,542 5,869 5,095
Increase in restricted cash from collections on auto loan receivables (49,707) (34,823) (35,012)
Increase in restricted cash in reserve accounts (12,264) (16,556) (10,403)
Release of restricted cash from reserve accounts 8,357 6,346 19,202
Purchases of money market securities, net (6,168) (8,604) (3,661)
Purchases of trading securities (5,295) (3,814) (2,051)
Sales of trading securities 324 655 466
NET CASH USED IN INVESTING ACTIVITIES (378,795) (360,744) (336,681)
FINANCING ACTIVITIES:
(Decrease) increase in short-term debt, net (357) 203 227
Proceeds from issuances of long-term debt 2,057,100 985,000 —
Payments on long-term debt (1,652,100) (675,000) —
Cash paid for debt issuance costs (3,104) (1,190) —
Payments on finance and capital lease obligations (16,417) (18,243) (19,596)
Issuances of non-recourse notes payable 9,553,805 7,783,000 6,907,000
Payments on non-recourse notes payable (8,496,684) (6,560,815) (5,513,646)
Repurchase and retirement of common stock (983,941) (924,328) (313,394)
Equity issuances 47,038 89,810 45,146
Excess tax benefits from share-based payment arrangements 32,136 50,142 22,644
NET CASH PROVIDED BY FINANCING ACTIVITIES 537,476 728,579 1,128,381
Increase (decrease) in cash and cash equivalents 9,788 (600,295) 178,537
Cash and cash equivalents at beginning of year 27,606 627,901 449,364
CASH AND CASH EQUIVALENTS AT END OF YEAR $ 37,394 $ 27,606 $ 627,901
SUPPLEMENTAL DISCLOSURES OF CASH FLOW INFORMATION
Cash paid for interest $ 43,526 $ 33,043 $ 30,991
Cash paid for income taxes $ 319,978 $ 346,865 $ 287,000
Non-cash investing and financing activities:
Increase in accrued capital expenditures $ 16,222 $ 3,698 $ 11,468
Increase in finance and capital lease obligations $ 103,233 $ 11,697 $ —
See accompanying notes to consolidated financial statements.