CarMax 2016 Annual Report Download - page 25
Download and view the complete annual report
Please find page 25 of the 2016 CarMax annual report below. You can navigate through the pages in the report by either clicking on the pages listed below, or by using the keyword search tool below to find specific information within the annual report.-
 1
1 -
2
-
3
-
4
-
5
-
6
-
7
-
8
-
9
-
10
-
11
-
12
-
13
-
14
-
 15
15 -
 16
16 -
 17
17 -
 18
18 -
 19
19 -
 20
20 -
 21
21 -
 22
22 -
 23
23 -
 24
24 -
 25
25 -
 26
26 -
 27
27 -
 28
28 -
 29
29 -
 30
30 -
 31
31 -
 32
32 -
 33
33 -
 34
34 -
 35
35 -
36
-
37
-
38
-
39
-
40
-
41
-
42
-
43
-
44
-
45
-
46
-
47
-
48
-
49
-
50
-
51
-
52
-
53
-
54
-
55
-
56
-
57
-
58
-
59
-
60
-
61
-
62
-
63
-
64
-
65
-
66
-
67
-
68
-
69
-
70
-
71
-
72
-
73
-
74
-
75
-
76
-
77
-
78
-
79
-
80
-
81
-
82
-
83
-
84
-
85
-
86
-
87
-
88
 |
 |
21
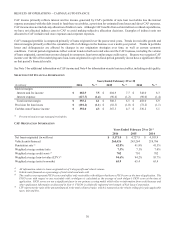
Item 6. Selected Financial Data.
(Dollars and shares in millions, except per share or per unit data) FY16 FY15 FY14 FY13 FY12
Income statement information
Used vehicle sales $ 12,439.4 $ 11,674.5 $ 10,306.3 $ 8,747.0 $ 7,826.9
Wholesale vehicle sales 2,188.3 2,049.1 1,823.4 1,759.6 1,721.6
Net sales and operating revenues 15,149.7 14,268.7 12,574.3 10,962.8 10,003.6
Gross profit 2,018.8 1,887.5 1,648.7 1,464.4 1,378.8
CarMax Auto Finance income 392.0 367.3 336.2 299.3 262.2
Selling, general and administrative expenses 1,351.9 1,257.7 1,155.2 1,031.0 940.8
Interest expense 36.4 24.5 30.8 32.4 33.7
Net earnings 623.4 597.4 492.6 434.3 413.8
Share and per share information
Weighted average diluted shares outstanding 205.5 218.7 227.6 231.8 230.7
Diluted net earnings per share $ 3.03 $ 2.73 $ 2.16 $ 1.87 $ 1.79
Balance sheet information
Auto loan receivables, net $ 9,536.9 $ 8,435.5 $ 7,147.8 $ 5,895.9 $ 4,959.8
Total assets 14,481.6 13,198.2 11,707.2 9,888.6 8,331.5
Total current liabilities 1,005.2 997.2 875.5 684.2 646.3
Total notes payable and other debt:
Non-recourse notes payable 9,527.8 8,470.6 7,248.4 5,855.1 4,684.1
Other 1,130.1 638.6 334.9 354.0 368.7
Unit sales information
Used vehicle units sold 619,936 582,282 526,929 447,728 408,080
Wholesale vehicle units sold 394,437 376,186 342,576 324,779 316,649
Per unit information
Used vehicle gross profit $ 2,159 $ 2,179 $ 2,171 $ 2,170 $ 2,177
Wholesale vehicle gross profit 984 970 916 949 953
SG&A per used vehicle unit (1) 2,181 2,160 2,192 2,303 2,305
Percent changes in
Comparable store used vehicle unit sales 2.4% 4.4% 12.2% 5.4% 1.3%
Total used vehicle unit sales 6.5 10.5 17.7 9.7 3.0
Wholesale vehicle unit sales 4.9 9.8 5.5 2.6 20.4
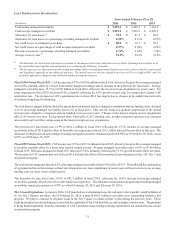
CarMax Auto Finance information
CAF total interest margin (2) 6.1% 6.5% 6.9% 7.4% 7.3%
Other information
Used car stores 158 144 131 118 108
Associates 22,429 22,064 20,171 18,111 16,460
(1) Beginning fiscal 2016, SG&A per unit calculations are based on used units. All periods presented have been revised for this new
presentation.
(2) Represents CAF total interest margin (which reflects the spread between interest and fees charged to consumers and our funding costs)
as a percentage of total average managed receivables.