Bridgestone 2008 Annual Report Download - page 15
Download and view the complete annual report
Please find page 15 of the 2008 Bridgestone annual report below. You can navigate through the pages in the report by either clicking on the pages listed below, or by using the keyword search tool below to find specific information within the annual report.-
 1
1 -
2
-
3
-
4
-
 5
5 -
 6
6 -
 7
7 -
 8
8 -
 9
9 -
 10
10 -
 11
11 -
 12
12 -
 13
13 -
 14
14 -
 15
15 -
 16
16 -
 17
17 -
 18
18 -
 19
19 -
 20
20 -
 21
21 -
 22
22 -
 23
23 -
 24
24 -
 25
25 -
26
-
27
-
28
-
29
-
30
-
31
-
32
-
33
-
34
-
35
-
36
-
37
-
38
-
39
-
40
-
41
-
42
-
43
-
44
 |
 |

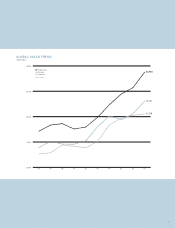
15%
15%
43%
27%
2008
2007
2006
2005
2004
69.0
147.5
117.6
138.3
131.1
8.0%
15.7
13.1
16.1
16.1
OperatingIncome/OperatingIncomeMargin
¥ billion /%
2008
2007
2006
2005
2004
864.9
941.5
896.7
858.5
814.6
NetSales
¥ billion
jAPAN
EUROPE
OTHERS
THE AMERICAS
2008
2007
2006
2005
2004
21.6
51.5
42.1
39.0
26.7
1.5%
3.4
3.2
3.4
2.6
OperatingIncome/OperatingIncomeMargin
¥ billion /%
2008
2007
2006
2005
2004
1,403.0
1,498.0
1,324.0
1,151.5
1,013.5
NetSales
¥ billion
2008
2007
2006
2005
2004
–4.9
17.2
14.9
19.6
22.0
3.4
3.6
5.4
6.8
OperatingIncome/OperatingIncomeMargin
¥ billion /%
2008
2007
2006
2005
2004
471.0
511.7
414.0
363.1
321.7
NetSales
¥ billion
2008
2007
2006
2005
2004
35.4
37.6
20.3
21.1
17.7
8.6
5.7
6.6
6.6
7.2%
OperatingIncome/OperatingIncomeMargin
¥ billion /%
2008
2007
2006
2005
2004
495.4
439.1
356.5
318.3
266.8
NetSales
¥ billion
Geographic Segments
Note: Net sales exclude inter-segment transactions.
13