Bridgestone 2008 Annual Report Download - page 13
Download and view the complete annual report
Please find page 13 of the 2008 Bridgestone annual report below. You can navigate through the pages in the report by either clicking on the pages listed below, or by using the keyword search tool below to find specific information within the annual report.-
 1
1 -
2
-
 3
3 -
 4
4 -
 5
5 -
 6
6 -
 7
7 -
 8
8 -
 9
9 -
 10
10 -
 11
11 -
 12
12 -
 13
13 -
 14
14 -
 15
15 -
 16
16 -
 17
17 -
 18
18 -
 19
19 -
 20
20 -
 21
21 -
 22
22 -
 23
23 -
24
-
25
-
26
-
27
-
28
-
29
-
30
-
31
-
32
-
33
-
34
-
35
-
36
-
37
-
38
-
39
-
40
-
41
-
42
-
43
-
44
 |
 |

2008 2007 2006 2008/2007 2008
Millions of yen Percent change Thousands of U.S. dollars1
Net Sales ¥3,234,406 ¥3,390,219 ¥2,991,275 –4.6% $35,531,209
Overseas Sales 2,448,300 2,589,006 2,213,880 –5.4 26,895,529
Operating Income 131,551 249,962 190,876 –47.4 1,445,139
Net Income 10,412 131,630 85,121 –92.1 114,380
Total Equity 1,019,996 1,410,225 1,221,846 –27.7 11,205,053
Total Assets 2,768,470 3,359,255 3,053,440 –17.6 30,412,721
Capital Expenditures 275,301 272,381 261,335 1.1 3,024,289
Depreciation and Amortization 187,420 173,585 145,349 8.0 2,058,882
Research and Development 93,252 86,748 86,687 7.5 1,024,410
Net Return on Shareholders’ Equity (ROE)(%) 0.9 10.3 7.4 — —
Net Return on Total Assets (ROA)(%) 0.3 4.1 3.0 — —
Per Share Data Yen Percent changeU.S. dollars1
Net Income
Basic ¥13.33 ¥ 168.69 ¥ 109.10 –92.1% $0.15
Diluted 13.33 168.65 109.07 –92.1 0.15
Shareholders’ Equity21,263.30 1,757.23 1,511.43 –28.1 13.88
Cash Dividends 24.00 26.00 24.00 –7.7 0.26
1 Solely for the convenience of readers, the Japanese yen amounts in this annual repor t are translated into U.S. dollars at the rate of ¥91.03 to �1, the approximate year- end rate.Solely for the convenience of readers, the Japanese yen amounts in this annual report are translated into U.S. dollar s at the rate of ¥91.03 to �1, the approximate year-end rate.
2 Shareholder s’ equity is equity excluding stock acquisition rights and minority interests.
FINANCIAL HIGHLIGHTS
Bridgestone Corporation and Subsidiaries
Years ended December 31, 2008, 2007, and 2006
2008
2007
2006
2005
2004
3,234.4
3,390.2
2,991.3
2,691.4
2,416.7
2,448.3
2,589.0
2,213.9
1,945.3
1,700.6
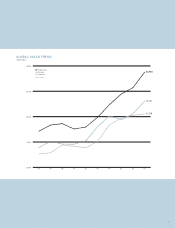
NetSales /OverseasSales
¥ billion
70X30.5
2008
2007
2006
2005
2004
131.6
250.0
190.9
213.9
197.7
4.1%
7.4
6.4
7.9
8.2
OperatingIncome/OperatingIncomeMargin
¥ billion /%
2008
2007
2006
2005
2004
10.4
131.6
85.1
180.8
114.5
0.9% /
10.3
7.4
17.5
12.6
NetIncome /ROE
¥ billion /%
• Net sales totaled ¥3,234.4 billion, a 5% decrease from scal 2007
• Operating income totaled ¥131.6 billion, down 47%
• Net income amounted to ¥10.4 billion, a 92% decrease
Note: Net sales exclude inter-segment transactions.
11