Bed, Bath and Beyond 2001 Annual Report Download - page 6
Download and view the complete annual report
Please find page 6 of the 2001 Bed, Bath and Beyond annual report below. You can navigate through the pages in the report by either clicking on the pages listed below, or by using the keyword search tool below to find specific information within the annual report.-
 1
1 -
 2
2 -
 3
3 -
 4
4 -
 5
5 -
 6
6 -
 7
7 -
 8
8 -
 9
9 -
 10
10 -
 11
11 -
 12
12 -
 13
13 -
 14
14 -
 15
15 -
 16
16 -
 17
17 -
18
-
19
 |
 |

BED BATH & BEYOND ANNUAL REPORT 2001
4
Approximately 55% and 45% of net sales in fiscal 2000
were attributable to sales of domestics merchandise and home
furnishings, respectively. The Company estimates that bed linens
accounted for approximately 21% of net sales during both fiscal
2000 and fiscal 1999. No other individual product category
accounted for 10% or more of net sales during either fiscal year.
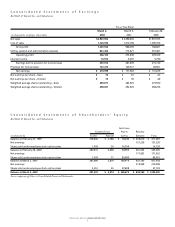
Gross profit in fiscal 2000 was $986.5 million or 41.2% of
net sales, compared with $766.8 million or 41.3% of net sales
in fiscal 1999.
Comparable store sales for fiscal 2000 (52 weeks vs. 52
weeks) increased by approximately 5.0%, compared with an
increase of approximately 9.2% in fiscal 1999. The fiscal 2000
increase in comparable store net sales primarily reflected a strong
focus on customer service, as well as the continued consumer
acceptance of the Company’s merchandise offerings and the
continued success of the Company’s advertising program.
SG&A was $713.6 million or 29.8% of net sales in fiscal 2000
compared to $557.5 million or 30.0% of net sales in fiscal 1999.
The decrease in SG&A as a percentage of net sales primarily
reflected a decrease in occupancy costs and costs associated with
new store openings and expansions partially offset by an increase
in payroll and payroll related items. Store opening and expansion
costs were charged to earnings as incurred.
Interest income increased to $9.0 million in fiscal 2000
compared to $5.8 million in fiscal 1999 due to an increase in
invested cash and an increase in the average investment rate.
The effective tax rate remained consistent at 39.0% in fiscal
2000 and fiscal 1999 due to the consistent composition of states
in which the Company conducted business.
EXPANSION PROGRAM
The Company is engaged in an ongoing expansion program
involving the opening of new stores in both new and existing
markets and the expansion or replacement of existing stores with
larger stores. In the ten-year period from the beginning of fiscal
1992 to the end of fiscal 2001, the chain has grown from 34 stores
to 396 stores. Total square footage grew from 917,000 square feet
at the beginning of fiscal 1992 to 14,724,000 square feet at the
end of fiscal 2001.
The Company intends to continue its expansion program
and currently anticipates that in fiscal 2002 it will open
approximately 88 new Bed Bath & Beyond stores (see details
under “Liquidity and Capital Resources” below). The Company
believes that a predominant portion of any increase in its net
sales in fiscal 2002 will continue to be attributable to new store
net sales. Accordingly, the continued growth of the Company
is dependent, in large part, upon the Company’s ability to
execute its expansion program successfully, of which there can
be no assurance.
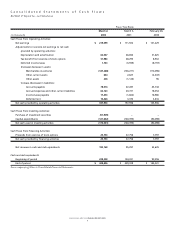
LIQUIDITY AND CAPITAL RESOURCES
The Company has been able to finance both its normal
operations and its expansion program through internally
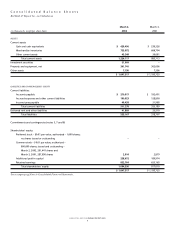
generated funds. The Company’s merchandise inventories have
grown from $470.4 million at the end of fiscal 1999, to $606.7
million at the end of fiscal 2000 and to $754.0 million at the end
of fiscal 2001. The increases in inventory between the fiscal years
were primarily attributable to the addition of new store space.
The Company’s working capital increased from $360.6
million at the end of fiscal 1999, to $532.5 million at the end of
fiscal 2000, and to $715.4 million at the end of fiscal 2001. The
increases between the fiscal years were primarily the result of
increases in cash and cash equivalents and merchandise
inventories, which were partially offset by increases in accounts
payable and accrued expenses and other current liabilities.
The Company’s expansion program requires the Company
to make capital expenditures for furniture and fixtures, leasehold
improvements and computer equipment on an ongoing basis.
The Company’s total capital expenditures were $121.6 million,
$140.4 million and $90.1 million during fiscal 2001, 2000 and
1999, respectively.
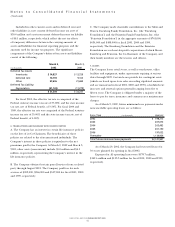
During fiscal 2001, the Company entered into a $50 million
uncommitted line of credit which replaced the Company’s
previous $25 million committed line of credit (“the Credit
Agreement”). The uncommitted line of credit, which expires in
September 2002, is intended to be used for letters of credit in the
ordinary course of business. During fiscal 2001, the Company
had no direct borrowings under the uncommitted line of credit
or the Credit Agreement; during fiscal 2000 and 1999, the
Company did not borrow under the Credit Agreement. The
Company believes that during fiscal 2002, internally generated
funds will be sufficient to fund both its normal operations and its
expansion program.
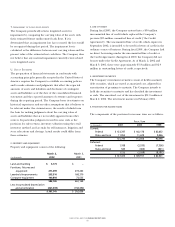
The Company has contractual obligations consisting of all
operating leases for buildings, office facilities and equipment
which are payable as follows as of March 2, 2002:
LESS THAN 1AFTER 5
(in 000’s) TOTAL YEAR 1-3 YEARS 4-5 YEARS YEARS
Operating
Leases $2,141,947 $198,275 $611,716 $385,997 $945,959
As of May 3, 2002, the Company has leased sites for 61 new
Bed Bath & Beyond stores planned for opening in fiscal 2002,
including eleven new stores already opened in Encino
and Monrovia, California; Grand Junction, Colorado; Manchester,
Connecticut; Cumming, Georgia; Woodbury, Minnesota; Mount
Olive, New Jersey; Onslow, North Carolina; Eastgate, Ohio; Erie,
Pennsylvania; and Lynchburg, Virginia.
Management’s Discussion and Analysis of Financial Condition
and Results of Operations
(Continued)