Bed, Bath and Beyond 2001 Annual Report Download - page 16
Download and view the complete annual report
Please find page 16 of the 2001 Bed, Bath and Beyond annual report below. You can navigate through the pages in the report by either clicking on the pages listed below, or by using the keyword search tool below to find specific information within the annual report.-
 1
1 -
2
-
3
-
4
-
5
-
 6
6 -
 7
7 -
 8
8 -
 9
9 -
 10
10 -
 11
11 -
 12
12 -
 13
13 -
 14
14 -
 15
15 -
 16
16 -
 17
17 -
 18
18 -
 19
19
 |
 |

BED BATH & BEYOND ANNUAL REPORT 2001
14
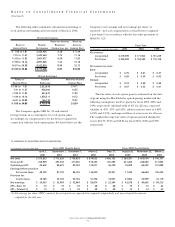
12. SUMMARY OF QUARTERLY RESULTS (UNAUDITED)
(in thousands, except per share data) FISCAL 2001 QUARTER ENDED FISCAL 2000 QUARTER ENDED
June 2, September 1, December 1, March 2, May 27, August 26, November 25, March 3,
2001 2001 2001 2002 2000 2000 2000 2001
Net sales $ 575,833 $ 713,636 $ 759,438 $ 879,055 $ 459,163 $ 589,381 $ 602,004 $ 746,107
Gross profit 234,959 291,342 311,030 370,235 187,293 241,284 246,080 311,802
Operating profit 45,602 84,672 83,749 132,077 36,339 70,009 64,592 101,898
Earnings before provision
for income taxes 48,792 87,730 86,120 134,430 38,301 71,440 66,664 105,434
Provision for
income taxes 18,785 33,776 33,156 51,756 14,937 27,862 25,999 41,119
Net earnings $ 30,007 $ 53,954 $ 52,964 $ 82,674 $ 23,364 $ 43,578 $ 40,665 $ 64,315
EPS – Basic (1) $ .10 $ .19 $ .18 $ .28 $ .08 $ .15 $ .14 $ .22
EPS – Diluted (1) $ .10 $ .18 $ .18 $ .28 $ .08 $ .15 $ .14 $ .22
(1) Net earnings per share (“EPS”) amounts for each quarter are required to be computed independently and may not equal the amount
computed for the total year.
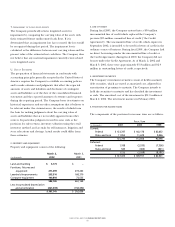
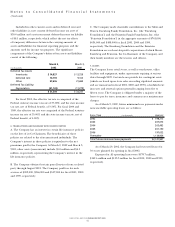
The following tables summarize information pertaining to
stock options outstanding and exercisable at March 2, 2002:
OPTIONS OUTSTANDING
WEIGHTED-AVERAGE WEIGHTED
RANGE OF NUMBER REMAINING AVERAGE-
EXERCISE PRICES OUTSTANDING CONTRACTUAL LIFE EXERCISE PRICE
$ 1.06 to 7.81 5,542,956 4.38 $ 5.39
7.91 to 11.47 5,445,560 7.73 11.16
11.83 to 11.83 3,067,477 6.24 11.83
11.94 to 16.16 4,897,065 7.32 15.18
16.81 to 34.88 4,163,950 8.99 22.72
$ 1.06 to 34.88 23,117,008 6.87 $12.80
OPTIONS EXERCISABLE
RANGE OF NUMBER WEIGHTED-AVERAGE
EXERCISE PRICES EXERCISABLE EXERCISE PRICE
$1.06 to 7.81 2,823,836 $ 4.71
7.91 to 11.47 958,000 10.55
11.83 to 11.83 601,637 11.83
11.94 to 16.16 1,626,311 14.72
16.81 to 34.88 146,130 19.07
$ 1.06 to 34.88 6,155,914 $ 9.30
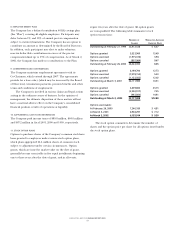
The Company applies APB No. 25 and related
interpretations in accounting for its stock option plans.
Accordingly, no compensation cost has been recognized in
connection with the stock option plans. Set forth below are the
Company’s net earnings and net earnings per share “as
reported,” and as if compensation cost had been recognized
(“pro-forma”) in accordance with the fair value provisions of
SFAS No. 123:
FISCAL YEAR
(in thousands, except per share data) 2001 2000 1999
NET EARNINGS:
As reported $ 219,599 $ 171,922 $ 131,229
Pro forma $ 200,009 $ 154,540 $ 119,158
NET EARNINGS PER SHARE:
Basic:
As reported $ 0.76 $ 0.61 $ 0.47
Pro forma $ 0.69 $ 0.54 $ 0.43
Diluted:
As reported $ 0.74 $ 0.59 $ 0.46
Pro forma $ 0.67 $ 0.53 $ 0.41
The fair value of each option grant is estimated on the date
of grant using the Black-Scholes option-pricing model with the
following assumptions used for grants for fiscal 2001, 2000 and
1999, respectively: dividend yield of 0% for all years; expected
volatility of 45%, 45% and 42%; risk-free interest rates of 4.80%,
6.58% and 5.95%; and expected lives of seven years for all years.
The weighted-average fair value of options granted during the
year is $12.77, $7.25 and $8.34 for fiscal 2001, 2000 and 1999,
respectively.
Notes to Consolidated Financial Statements
(Continued)