Bed, Bath and Beyond 2001 Annual Report Download - page 2
Download and view the complete annual report
Please find page 2 of the 2001 Bed, Bath and Beyond annual report below. You can navigate through the pages in the report by either clicking on the pages listed below, or by using the keyword search tool below to find specific information within the annual report.-
 1
1 -
 2
2 -
 3
3 -
 4
4 -
 5
5 -
 6
6 -
 7
7 -
 8
8 -
 9
9 -
 10
10 -
 11
11 -
 12
12 -
 13
13 -
14
-
15
-
16
-
17
-
18
-
19
 |
 |

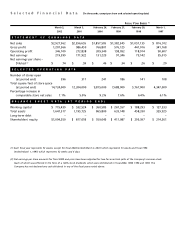
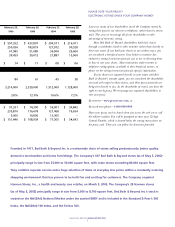
FISCAL YEAR ENDED (1)
March 2, March 3, February 26, February 27, February 28, March 1,
2002 2001 2000 1999 1998 1997
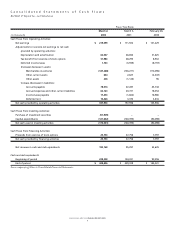
Net sales $2,927,962 $2,396,655 $1,857,505 $1,382,345 $1,057,135 $ 816,912
Gross profit 1,207,566 986,459 766,801 576,125 441,016 341,168
Operating profit 346,100 272,838 209,340 158,052 118,914 90,607
Net earnings 219,599 171,922 131,229 97,346 73,142 55,015
Net earnings per share –
Diluted (2) $ .74 $ .59 $ .46 $ .34 $ .26 $ .20
Number of stores open
(at period end) 396 311 241 186 141 108
Total square feet of store space
(at period end) 14,724,000 12,204,000 9,815,000 7,688,000 5,767,000 4,347,000
Percentage increase in
comparable store net sales 7.1% 5.0% 9.2% 7.6% 6.4% 6.1%
Working capital $ 715,439 $ 532,524 $ 360,585 $ 267,557 $ 188,293 $ 127,333
Total assets 1,647,517 1,195,725 865,800 633,148 458,330 329,925
Long-term debt – – – – – –
Shareholders’ equity $1,094,350 $ 817,018 $ 559,045 $ 411,087 $ 295,397 $ 214,361
STATEMENT OF EARNINGS DATA
SELECTED OPERATING DATA
BALANCE SHEET DATA (AT PERIOD END)
(1) Each fiscal year represents 52 weeks, except for fiscal 2000 (ended March 3, 2001) which represents 53 weeks and fiscal 1996
(ended March 1, 1997) which represents 52 weeks and 6 days.
(2) Net earnings per share amounts for fiscal 2000 and prior have been adjusted for two-for-one stock splits of the Company’s common stock
(each of which was effected in the form of a 100% stock dividend), which were distributed in fiscal 2000, 1998, 1996 and 1993. The
Company has not declared any cash dividends in any of the fiscal years noted above.
Selected Financial Data (in thousands, except per share and selected operating data)