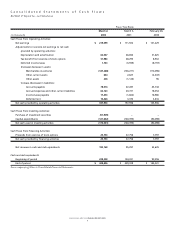
Bed, Bath and Beyond 2001 Annual Report Download - page 5
Download and view the complete annual report
Please find page 5 of the 2001 Bed, Bath and Beyond annual report below. You can navigate through the pages in the report by either clicking on the pages listed below, or by using the keyword search tool below to find specific information within the annual report.-
 1
1 -
 2
2 -
 3
3 -
 4
4 -
 5
5 -
 6
6 -
 7
7 -
 8
8 -
 9
9 -
 10
10 -
 11
11 -
 12
12 -
 13
13 -
 14
14 -
 15
15 -
 16
16 -
17
-
18
-
19
 |
 |

BED BATH & BEYOND ANNUAL REPORT 2001
3
FISCAL 2001 COMPARED WITH FISCAL 2000
In fiscal 2001 (52 weeks), the Company expanded store space
by 20.6%, from 12,204,000 square feet at fiscal year end 2000
(53 weeks) to 14,724,000 square feet at fiscal year end 2001.
The 2,520,000 square feet increase was the result of opening
85 new stores.
Net sales in fiscal 2001 increased $531.3 million to $2.928
billion, representing an increase of 22.2% over the $2.397 billion
net sales in fiscal 2000. Approximately 73% of the increase was
attributable to new store net sales and the balance to an increase
in comparable store net sales.
Approximately 54% and 46% of net sales in fiscal 2001 were
attributable to sales of domestics merchandise and home
furnishings, respectively. The Company estimates that bed linens
accounted for approximately 19% of net sales during fiscal 2001
and 21% of net sales during fiscal 2000. No other individual
product category accounted for 10% or more of net sales during
either fiscal year.
Gross profit in fiscal 2001 was $1.208 billion or 41.2% of
net sales, compared with $986.5 million or 41.2% of net sales a
year ago. Gross profit, as a percentage of net sales, remained
consistent due to the similar product mix in fiscal 2001 and
fiscal 2000.
Comparable store sales for fiscal 2001 (52 weeks vs. 52
weeks) increased by approximately 7.1%, compared with an
increase of approximately 5.0% in fiscal 2000. The increase in
comparable store net sales relative to fiscal 2000 reflected a
number of factors, including but not limited to, the continued
consumer acceptance of the Company’s merchandise offerings,
a strong focus on customer service and the continued success of
the Company’s advertising program.
Selling, general and administrative expenses (“SG&A”) were
$861.5 million or 29.4% of net sales in fiscal 2001 compared to
$713.6 million or 29.8% of net sales in fiscal 2000. The decrease
in SG&A as a percentage of net sales primarily reflects a relative
decrease in payroll and payroll related items primarily due to an
increase in store productivity. Store opening and expansion costs
are charged to earnings as incurred.
Interest income increased to $11.0 million in fiscal 2001
compared to $9.0 million in fiscal 2000 due to an increase in
invested cash partially offset by a decrease in the average
investment rate.
The effective tax rate decreased to 38.5% for fiscal 2001
compared with 39.0% for fiscal 2000 due to a decrease in the
amount provided for state and local taxes resulting primarily
from the composition of states and the territory in which the
Company currently conducts business.
FISCAL 2000 COMPARED WITH FISCAL 1999
In fiscal 2000 (53 weeks), the Company expanded store space by
24.3%, from 9,815,000 square feet at fiscal year end 1999 (52
weeks) to 12,204,000 square feet at fiscal year end 2000. The
2,389,000 square feet increase was the result of opening 70 new
stores and expanding two existing stores.
Net sales in fiscal 2000 increased $539.2 million to $2.397
billion, representing an increase of 29.0% over the $1.858 billion
net sales in fiscal 1999. Approximately 83% of the increase was
attributable to new store net sales and the balance to an increase
in comparable store net sales.
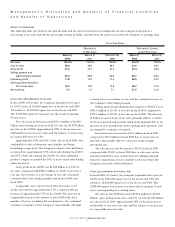
Management’s Discussion and Analysis of Financial Condition
and Results of Operations
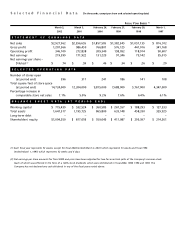
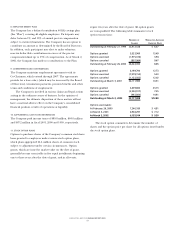
RESULTS OF OPERATIONS
The following table sets forth for the periods indicated (i) selected statement of earnings data of the Company expressed as a
percentage of net sales and (ii) the percentage change in dollar amounts from the prior year in selected statement of earnings data:
FISCAL YEAR ENDED
PERCENTAGE PERCENTAGE CHANGE
OF NET SALES FROM PRIOR YEAR
MARCH 2, MARCH 3, FEBRUARY 26, MARCH 2, MARCH 3,
2002 2001 2000 2002 2001
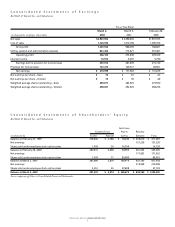
Net sales 100.0% 100.0% 100.0% 22.2% 29.0%
Cost of sales 58.8 58.8 58.7 22.0 29.3
Gross profit 41.2 41.2 41.3 22.4 28.6
Selling, general and
administrative expenses 29.4 29.8 30.0 20.7 28.0
Operating profit 11.8 11.4 11.3 26.9 30.3
Earnings before provision
for income taxes 12.2 11.8 11.6 26.7 31.0
Net earnings 7.5 7.2 7.1 27.7 31.0