Airtran 2004 Annual Report Download - page 7
Download and view the complete annual report
Please find page 7 of the 2004 Airtran annual report below. You can navigate through the pages in the report by either clicking on the pages listed below, or by using the keyword search tool below to find specific information within the annual report.-
 1
1 -
 2
2 -
 3
3 -
 4
4 -
 5
5 -
 6
6 -
 7
7 -
 8
8 -
 9
9 -
 10
10 -
 11
11 -
 12
12 -
 13
13 -
 14
14 -
 15
15 -
 16
16 -
 17
17 -
 18
18 -
19
-
20
-
21
-
22
-
23
-
24
-
25
-
26
-
27
-
28
-
29
-
30
-
31
-
32
-
33
-
34
-
35
-
36
-
37
-
38
-
39
-
40
-
41
-
42
-
43
-
44
 |
 |

7
2004 Annual Report
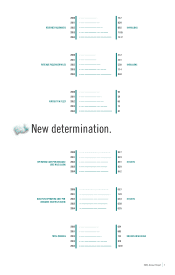
New determination.
•••••••••••••••••••••••••••••••
•••••••••••••••••••••••••••••••
•••••••••••••••••••••••••••••••
•••••••••••••••••••••••••••••••
•••••••••••••••••••••••••••••••
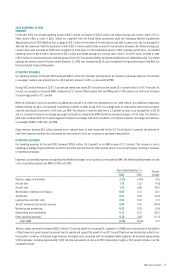
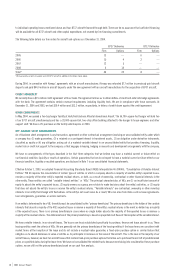
2000
2001
2002
2003
2004
REVENUE PASSENGERS IN MILLIONS
7.57
8.30
9.65
11.65
13.17
•••••••••••••••••••••••••••••••
•••••••••••••••••••••••••••••••
•••••••••••••••••••••••••••••••
•••••••••••••••••••••••••••••••
•••••••••••••••••••••••••••••••
2000
2001
2002
2003
2004
REVENUE PASSENGER MILES IN BILLIONS
4.12
4.51
5.58
7.14
8.48
•••••••••••••••••••••••••••••••
•••••••••••••••••••••••••••••••
•••••••••••••••••••••••••••••••
•••••••••••••••••••••••••••••••
•••••••••••••••••••••••••••••••
2000
2001
2002
2003
2004
AIRCRAFT IN FLEET
53
59
65
74
87
•••••••••••••••••••••••••••••••
•••••••••••••••••••••••••••••••
•••••••••••••••••••••••••••••••
•••••••••••••••••••••••••••••••
•••••••••••••••••••••••••••••••
2000
2001
2002
2003
2004
OPERATING COST PER AVAILABLE
SEAT MILE (CASM)
IN CENTS
9.27
9.33
8.51
8.28
8.42
•••••••••••••••••••••••••••••••
•••••••••••••••••••••••••••••••
•••••••••••••••••••••••••••••••
•••••••••••••••••••••••••••••••
•••••••••••••••••••••••••••••••
2000
2001
2002
2003
2004
NON-FUEL OPERATING COST PER
AVAILABLE SEAT MILE (CASM)
IN CENTS
6.87
7.20
6.64
6.50
6.35
•••••••••••••••••••••••••••••••
•••••••••••••••••••••••••••••••
•••••••••••••••••••••••••••••••
•••••••••••••••••••••••••••••••
•••••••••••••••••••••••••••••••
2000
2001
2002
2003
2004
TOTAL REVENUE DOLLARS IN MILLIONS
624
665
733
918
1,041