Airtran 2004 Annual Report Download - page 13
Download and view the complete annual report
Please find page 13 of the 2004 Airtran annual report below. You can navigate through the pages in the report by either clicking on the pages listed below, or by using the keyword search tool below to find specific information within the annual report.-
 1
1 -
2
-
 3
3 -
 4
4 -
 5
5 -
 6
6 -
 7
7 -
 8
8 -
 9
9 -
 10
10 -
 11
11 -
 12
12 -
 13
13 -
 14
14 -
 15
15 -
 16
16 -
 17
17 -
 18
18 -
 19
19 -
 20
20 -
 21
21 -
 22
22 -
 23
23 -
24
-
25
-
26
-
27
-
28
-
29
-
30
-
31
-
32
-
33
-
34
-
35
-
36
-
37
-
38
-
39
-
40
-
41
-
42
-
43
-
44
 |
 |

13
2004 Annual Report
2003 COMPARED TO 2002
SUMMARY
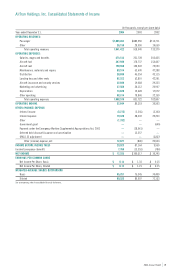
For the year 2003, we recorded operating income of $86.3 million, net income of $100.5 million and diluted earnings per common share of $1.21.
These results reflect a credit of $38.1 million for a payment from the United States government under the Emergency Wartime Supplemental
Appropriations Act of 2003 (Wartime Act), a charge of $12.3 million for the write off of debt discount and debt issuance costs due to early payoff of
debt and the conversion of debt to equity and a credit of $15.9 million created by the reversal of a tax valuation allowance. Our diluted earnings per
common share were increased by $0.48 upon recognition of these items. For the comparative period in 2002, including special items, we recorded
operating income of $30.6 million, net income of $10.7 million and diluted earnings per common share of $0.15. Our 2002 results included a credit
of $0.6 million for a government grant received pursuant to the Air Transportation Safety and System Stabilization Act (Stabilization Act). Our diluted
earnings per common share for the year ended December 31, 2002 were increased by $0.01 upon recognition of the government grant (see Note 3 to
the Consolidated Financial Statements).
OPERATING REVENUES
Our operating revenues for the year 2003 increased $184.7 million (25.2 percent) primarily due to an increase in passenger revenues. The increase
in passenger revenues was primarily due to a 28.0 percent increase in traffic, as measured by RPMs.
During 2003, we took delivery of 23 B717 aircraft and retired nine owned DC-9 aircraft and five leased DC-9 aircraft (total of 14 DC-9 aircraft). As
a result, our capacity, as measured ASMs, increased by 21.7 percent. When coupled with our RPM growth of 28.0 percent, our load factor increased
3.5 percentage points to 71.1 percent.
While we continued to grow our operations by adding new aircraft to our fleet, new destinations to our route network, and additional frequencies
between existing city pairs, we continued to experience a decline in yields during 2004. Our average yield, as measured by revenue per passenger
seat mile, decreased 2.6 percent to 12.46 cents per RPM. The reduction in yield resulted from a 3.3 percent increase in our average fare to $76.38
and a 6.1 percent increase in our average passenger trip length, as measured by RPMs divided by revenue passengers, to 613 miles. This decline in
yield, when combined with our 3.5 percentage point increase in passenger load factor, resulted in a 2.5 percent increase in passenger unit revenues,
or passenger RASM, to 8.86 cents per ASM.
Cargo revenues declined $0.5 million primarily due to reduced levels of mail transported for the U.S. Postal Service. In general, the demand for
short-haul cargo transportation has diminished and we continue to focus our resources on passenger transportation.
OPERATING EXPENSES
Our operating expenses for the year 2003 increased $128.9 million (18.3 percent) on an ASM increase of 21.7 percent. This increase is due to
operating an average of eight additional aircraft for the entire year and the end of the warranty period on our aircraft engines resulting in increases
to maintenance expense.
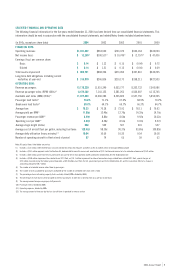
In general, our operating expenses are significantly affected by changes in our capacity, as measured by ASMs. The following table presents our unit
costs, or operating expenses per ASM, for 2003 and 2002:
Year Ended December 31, Percent
2003 2002 Change
Salaries, wages and benefits 2.31¢ 2.46¢ (6.1)
Aircraft fuel 1.78 1.87 (4.8)
Aircraft rent 1.24 0.88 40.9
Maintenance, materials and repairs 0.63 0.57 10.5
Distribution 0.45 0.52 (13.5)
Landing fees and other rents 0.52 0.51 2.0
Aircraft insurance and security services 0.20 0.36 (44.4)
Marketing and advertising 0.24 0.25 (4.0)
Depreciation and amortization 0.13 0.21 (38.1)
Other operating expenses 0.78 0.88 (11.4)
Total CASM 8.28¢ 8.51¢ (2.7)
Salaries, wages and benefits increased $28.3 million (13.9 percent overall or an improved 6.1 percent on a CASM basis) primarily due to the addition
of flight crews and ground support personnel hired to operate and support the growth of our B717 aircraft fleet and new destinations added to our
route system, as well as contractual wage increases and higher costs associated with our employee benefit programs. We employed approximately
5,500 employees (including approximately 5,300 full-time equivalents) at year-end 2003 representing roughly a 16.8 percent increase over the
comparative period.