Airtran 2004 Annual Report Download - page 11
Download and view the complete annual report
Please find page 11 of the 2004 Airtran annual report below. You can navigate through the pages in the report by either clicking on the pages listed below, or by using the keyword search tool below to find specific information within the annual report.-
 1
1 -
 2
2 -
 3
3 -
 4
4 -
 5
5 -
 6
6 -
 7
7 -
 8
8 -
 9
9 -
 10
10 -
 11
11 -
 12
12 -
 13
13 -
 14
14 -
 15
15 -
 16
16 -
 17
17 -
 18
18 -
 19
19 -
 20
20 -
 21
21 -
 22
22 -
23
-
24
-
25
-
26
-
27
-
28
-
29
-
30
-
31
-
32
-
33
-
34
-
35
-
36
-
37
-
38
-
39
-
40
-
41
-
42
-
43
-
44
 |
 |

11
2004 Annual Report
RESULTS OF OPERATIONS
2004 COMPARED TO 2003
SUMMARY
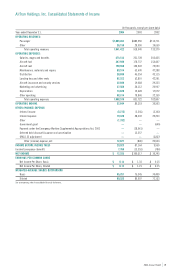
Our performance during 2004 marked a major financial milestone — we surpassed one billion dollars in total revenues for the year. For the year
2004 we recorded operating income of $32.8 million, net income of $12.3 million and diluted earnings per common share of $0.14. These results
reflect a $0.8 million net credit primarily related to our unsuccessful bid for certain leased gates and other assets of another airline at Chicago’s
Midway airport. Our diluted earnings per common share were increased by $0.01 upon recognition of the credit (see Note 9 to the Consolidated
Financial Statements).
For the comparative year in 2003 we recorded operating income of $86.3 million, net income of $100.5 million and diluted earnings per common
share of $1.21. These results reflect a credit of $38.1 million for a payment from the United States government under the Emergency Wartime
Supplemental Appropriations Act of 2003 (Wartime Act), a charge of $12.3 million for the write off of debt discount and debt issuance costs due to
early payoff of debt and the conversion of debt to equity and a credit of $15.9 million created by the reversal of a tax valuation allowance. Our diluted
earnings per common share were increased by $0.48 upon recognition of these items (see Notes 2 and 9 to the Consolidated Financial Statements).
OPERATING REVENUES
Our operating revenues for the year increased $123.4 million (13.4 percent) primarily due to an increase in passenger revenues. The increase in
passenger revenues was primarily due to an 18.7 percent increase in traffic, as measured by revenue passenger miles (RPMs).
We placed an order with an aircraft manufacturer in 2003 for up to 110 aircraft, including options and purchase rights. During 2004 we increased
our aircraft fleet by fourteen Boeing aircraft and retired one McDonnell Douglas DC-9 aircraft. As a result, our capacity, as measured by available
seat miles (ASMs), increased 19.2 percent. Our ASM growth, combined with our RPM growth of 18.7 percent decreased our passenger load factor by
0.3 percentage points to 70.8 percent.
Our average yield per RPM decreased 4.8 percent to 11.86 cents. The reduction in yield resulted from a 5.1 percent increase in our average passenger
trip length, as measured by RPMs divided by revenue passengers.
Other revenues increased $8.1 million primarily due to fees earned from our AirTran Airways branded credit card issued by a third party financial
institution, in addition to change and cancellation fees derived from our overall increase in traffic.
OPERATING EXPENSES
Our operating expenses for the year increased $176.9 million (21.3 percent) on an available seat mile (ASM) increase of 19.2 percent. Our financial
results are significantly affected by changes in the price we pay for aircraft fuel. During 2004, we experienced record aircraft fuel prices derived from
sharp increases in the cost of crude oil.
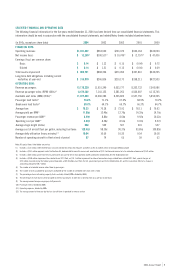
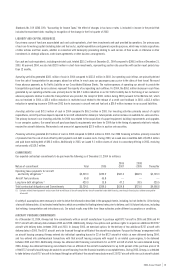
In general, our operating expenses are significantly affected by changes in our capacity, as measured by ASMs. The following table presents our unit
costs, or operating expenses per ASM, for 2004 and 2003:
Year Ended December 31, Percent
2004 2003 Change
Salaries, wages and benefits 2.28¢ 2.31¢ (1.3)
Aircraft fuel 2.07 1.78 16.3
Aircraft rent 1.26 1.24 1.6
Maintenance, materials and repairs 0.58 0.63 (7.9)
Distribution 0.42 0.45 (6.7)
Landing fees and other rents 0.52 0.52 —
Aircraft insurance and security services 0.19 0.20 (5.0)
Marketing and advertising 0.23 0.24 (4.2)
Depreciation and amortization 0.12 0.13 (7.7)
Other operating expenses 0.75 0.78 (3.8)
Total CASM 8.42¢ 8.28¢ 1.7
Salaries, wages and benefits increased $41.8 million (18.0 percent overall or a decrease of 1.3 percent on a CASM basis) primarily due to the addition
of flight crews and ground support personnel hired to operate and support the growth of our aircraft fleet and new destinations added to our route
system, as well as contractual wage increases and higher costs associated with our employee benefit programs. We employed approximately 6,100
employees (including approximately 5,900 full-time equivalents) at year-end 2004 representing roughly a 10.9 percent increase over the
comparative period.