Air New Zealand 2009 Annual Report Download - page 6
Download and view the complete annual report
Please find page 6 of the 2009 Air New Zealand annual report below. You can navigate through the pages in the report by either clicking on the pages listed below, or by using the keyword search tool below to find specific information within the annual report.-
 1
1 -
 2
2 -
 3
3 -
 4
4 -
 5
5 -
 6
6 -
 7
7 -
 8
8 -
 9
9 -
 10
10 -
 11
11 -
 12
12 -
 13
13 -
 14
14 -
 15
15 -
 16
16 -
 17
17 -
18
-
19
-
20
-
21
-
22
-
23
-
24
-
25
-
26
-
27
-
28
-
29
-
30
-
31
-
32
-
33
-
34
-
35
-
36
-
37
-
38
-
39
-
40
-
41
-
42
-
43
-
44
-
45
-
46
-
47
-
48
-
49
-
50
-
51
-
52
-
53
-
54
-
55
-
56
-
57
-
58
-
59
-
60
-
61
-
62
-
63
-
64
-
65
-
66
-
67
-
68
-
69
-
70
-
71
-
72
-
73
-
74
-
75
-
76
 |
 |

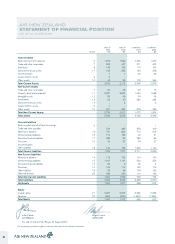
The accompanying accounting policies and notes form part of these financial statements.
AIR NEW ZEALAND
STATEMENT OF FINANCIAL POSITION
AS AT 30 JUNE 2009
NOTES
GROUP
2009
$M
GROUP
2008
$M
COMPANY
2009
$M
COMPANY
2008
$M
Current Assets
Bank and short term deposits 6 1,573 1,289 1,566 1,279
Trade and other receivables 7 362 447 311 403
Inventories 8 143 123 110 109
Derivative financial assets 17 143 208 143 208
Income taxation 7 7 60 33
Assets held for resale 9 3 - - -
Other assets 10 44 38 175 246
Total Current Assets 2,275 2,112 2,365 2,278
Non-Current Assets
Trade and other receivables 7 34 28 23 15
Property, plant and equipment 11 2,337 2,534 1,054 1,088
Intangible assets 12 39 40 34 35
Investments 13 62 49 284 284
Derivative financial assets 17 - 6 - 6
Assets held for resale 9 7 - - -
Other assets 10 291 254 278 236
Total Non-Current Assets 2,770 2,911 1,673 1,664
Total Assets 5,045 5,023 4,038 3,942
Current Liabilities
Bank overdraft and short term borrowings 6 - - - 1
Trade and other payables 374 480 332 419
Revenue in advance 14 721 822 712 815
Interest-bearing liabilities 15 172 158 22 21
Derivative financial liabilities 17 282 84 282 84
Provisions 16 34 27 34 27
Income taxation - - - -
Other liabilities 18 176 136 1,329 1,159
Total Current Liabilities 1,759 1,707 2,711 2,526
Non-Current Liabilities
Revenue in advance 14 114 109 114 109
Interest-bearing liabilities 15 1,107 1,167 230 253
Derivative financial liabilities 17 25 3 25 3
Provisions 16 164 116 162 115
Other liabilities 18 38 45 124 128
Deferred taxation 20 233 299 114 136
Total Non-Current Liabilities 1,681 1,739 769 744
Total Liabilities 3,440 3,446 3,480 3,270
Net Assets 1,605 1,577 558 672
Equity
Issued capital 21 2,237 2,227 2,245 2,235
Reserves 22 (632) (650) (1,687) (1,563)
Total Equity 1,605 1,577 558 672
John Palmer Roger France
CHAIRMAN DIRECTOR
For and on behalf of the Board, 27 August 2009
4