Air New Zealand 2009 Annual Report Download - page 55
Download and view the complete annual report
Please find page 55 of the 2009 Air New Zealand annual report below. You can navigate through the pages in the report by either clicking on the pages listed below, or by using the keyword search tool below to find specific information within the annual report.-
 1
1 -
2
-
3
-
4
-
5
-
6
-
7
-
8
-
9
-
10
-
11
-
12
-
13
-
14
-
15
-
16
-
17
-
18
-
19
-
20
-
21
-
22
-
23
-
24
-
25
-
26
-
27
-
28
-
29
-
30
-
31
-
32
-
33
-
34
-
35
-
36
-
37
-
38
-
39
-
40
-
41
-
42
-
43
-
44
-
 45
45 -
 46
46 -
 47
47 -
 48
48 -
 49
49 -
 50
50 -
 51
51 -
 52
52 -
 53
53 -
 54
54 -
 55
55 -
 56
56 -
 57
57 -
 58
58 -
 59
59 -
 60
60 -
 61
61 -
 62
62 -
 63
63 -
 64
64 -
 65
65 -
66
-
67
-
68
-
69
-
70
-
71
-
72
-
73
-
74
-
75
-
76
 |
 |
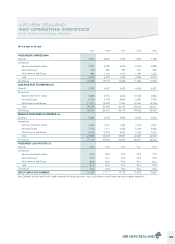
For the year to 30 June
2009 2008 2007 2006 2005
PASSENGERS CARRIED (000)
Domestic 7,815 8,206 7,736 7,356 7,180
International
Australia and Pacific Islands 2,781 3,005 2,995 2,908 2,838
Asia and Europe 778 865 734 591 647
North America and Europe 994 1,100 1,015 1,037 1,025
Total 4,553 4,970 4,744 4,536 4,510
Total Group 12,368 13,176 12,480 11,892 11,690
AVAILABLE SEAT KILOMETRES (m)
Domestic 4,783 4,987 4,639 4,455 4,281
International
Australia and Pacific Islands 9,383 9,761 9,949 10,185 9,845
Asia and Europe 8,780 9,748 8,565 6,856 7,398
North America and Europe 11,370 12,495 11,960 12,559 12,168
Total 29,533 32,004 30,474 29,600 29,411
Total Group 34,316 36,991 35,113 34,055 33,692
REVENUE PASSENGER KILOMETRES (m)
Domestic 3,586 3,722 3,493 3,345 3,264
International
Australia and Pacific Islands 7,094 7,612 7,487 7,219 7,037
Asia and Europe 7,016 7,711 6,422 5,049 5,468
North America and Europe 9,416 10,304 9,472 9,938 9,799
Total 23,526 25,627 23,381 22,206 22,304
Total Group 27,112 29,349 26,874 25,551 25,568
PASSENGER LOAD FACTOR (%)
Domestic 75.0 74.6 75.3 75.1 76.2
International
Australia and Pacific Islands 75.6 78.0 75.3 70.9 71.5
Asia and Europe 79.9 79.1 75.0 73.6 73.9
North America and Europe 82.8 82.5 79.2 79.1 80.5
Total 81.0 81.0 76.7 75.0 75.8
Total Group 79.0 79.3 76.5 75.0 75.9
GROUP EMPLOYEE NUMBERS 10,726 11,111 10,713 10,233 10,829
New Zealand, Australia and Pacific Islands represent shorthaul operations. Asia, North America and Europe represent longhaul operations.
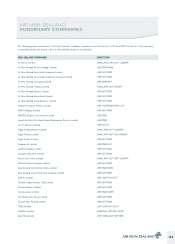
AIR NEW ZEALAND
KEY OPERATING STATISTICS
FIVE YEAR STATISTICAL REVIEW
53