Air New Zealand 2009 Annual Report Download - page 33
Download and view the complete annual report
Please find page 33 of the 2009 Air New Zealand annual report below. You can navigate through the pages in the report by either clicking on the pages listed below, or by using the keyword search tool below to find specific information within the annual report.-
 1
1 -
2
-
3
-
4
-
5
-
6
-
7
-
8
-
9
-
10
-
11
-
12
-
13
-
14
-
15
-
16
-
17
-
18
-
19
-
20
-
21
-
22
-
 23
23 -
 24
24 -
 25
25 -
 26
26 -
 27
27 -
 28
28 -
 29
29 -
 30
30 -
 31
31 -
 32
32 -
 33
33 -
 34
34 -
 35
35 -
 36
36 -
 37
37 -
 38
38 -
 39
39 -
 40
40 -
 41
41 -
 42
42 -
 43
43 -
44
-
45
-
46
-
47
-
48
-
49
-
50
-
51
-
52
-
53
-
54
-
55
-
56
-
57
-
58
-
59
-
60
-
61
-
62
-
63
-
64
-
65
-
66
-
67
-
68
-
69
-
70
-
71
-
72
-
73
-
74
-
75
-
76
 |
 |

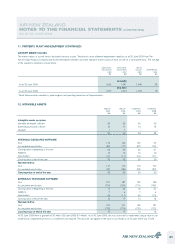
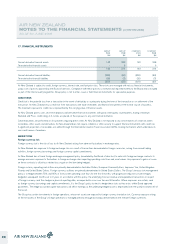
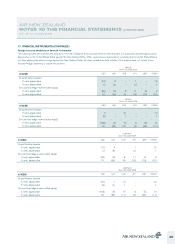
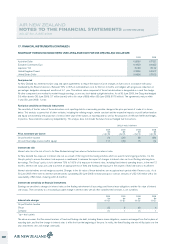
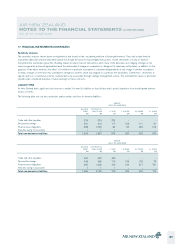
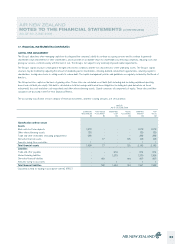
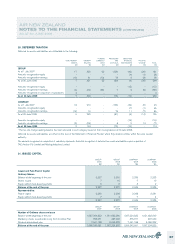
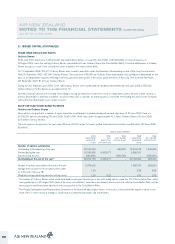
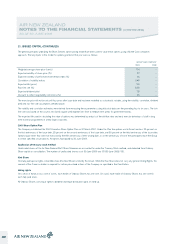
17. FINANCIAL INSTRUMENTS (CONTINUED)
Sensitivity analyses
The sensitivity analyses shown above are hypothetical and should not be considered predictive of future performance. They only include financial
instruments (derivative and non-derivative) and do not include the future forecast hedged transactions. As the sensitivities are only on financial
instruments the sensitivities ignore the offsetting impact on future forecast transactions which many of the derivatives are hedging. Changes in fair
value can generally not be extrapolated because the relationship of change in assumption to change in fair value may not be linear. In addition, for the
purposes of the above analyses, the effect of a variation in a particular assumption is calculated independently of any change in another assumption.
In reality, changes in one factor may contribute to changes in another, which may magnify or counteract the sensitivities. Furthermore, sensitivities to
specific events or circumstances will be counteracted as far as possible through strategic management actions. The estimated fair values as disclosed
should not be considered indicative of future earnings on these contracts.
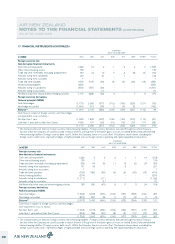
LIQUIDITY RISK
Air New Zealand holds significant cash reserves to enable it to meet its liabilities as they fall due and to protect operations from unanticipated external
factors or events.
The following table sets out the contractual, undiscounted cash flows for financial liabilities:
GROUP
AS AT 30 JUNE 2009
BALANCE
SHEET
$M
CONTRACTUAL
CASH FLOWS
$M
< 1 YEAR
$M
1-2 YEARS
$M
2-5 YEARS
$M
5+ YEARS
$M
Trade and other payables 374 374 374 - - -
Secured borrowings 391 412 117 123 111 61
Finance lease obligations 888 1,060 82 84 282 612
Amounts owing to associates 1 1 1 - - -
Total non-derivative liabilities 1,654 1,847 574 207 393 673
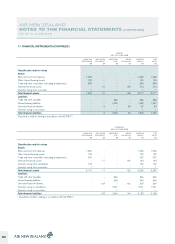
GROUP
AS AT 30 JUNE 2008
BALANCE
SHEET
$M
CONTRACTUAL
CASH FLOWS
$M
< 1 YEAR
$M
1-2 YEARS
$M
2-5 YEARS
$M
5+ YEARS
$M
Trade and other payables 480 480 480 - - -
Secured borrowings 445 486 116 105 192 73
Finance lease obligations 880 1,228 106 104 317 701
Amounts owing to associates 1 1 1 - - -
Total non-derivative liabilities 1,806 2,195 703 209 509 774
AIR NEW ZEALAND
NOTES TO THE FINANCIAL STATEMENTS (CONTINUED)
AS AT 30 JUNE 2009
31