Air New Zealand 2009 Annual Report Download - page 21
Download and view the complete annual report
Please find page 21 of the 2009 Air New Zealand annual report below. You can navigate through the pages in the report by either clicking on the pages listed below, or by using the keyword search tool below to find specific information within the annual report.-
 1
1 -
2
-
3
-
4
-
5
-
6
-
7
-
8
-
9
-
10
-
 11
11 -
 12
12 -
 13
13 -
 14
14 -
 15
15 -
 16
16 -
 17
17 -
 18
18 -
 19
19 -
 20
20 -
 21
21 -
 22
22 -
 23
23 -
 24
24 -
 25
25 -
 26
26 -
 27
27 -
 28
28 -
 29
29 -
 30
30 -
 31
31 -
32
-
33
-
34
-
35
-
36
-
37
-
38
-
39
-
40
-
41
-
42
-
43
-
44
-
45
-
46
-
47
-
48
-
49
-
50
-
51
-
52
-
53
-
54
-
55
-
56
-
57
-
58
-
59
-
60
-
61
-
62
-
63
-
64
-
65
-
66
-
67
-
68
-
69
-
70
-
71
-
72
-
73
-
74
-
75
-
76
 |
 |

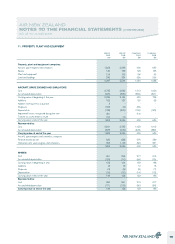
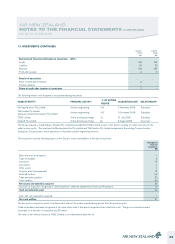
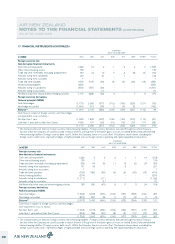
11. PROPERTY, PLANT AND EQUIPMENT
GROUP
2009
$M
GROUP
2008
$M
COMPANY
2009
$M
COMPANY
2008
$M
Property, plant and equipment comprises:
Aircraft, spare engines and simulators 1,828 2,036 600 630
Spares 149 158 123 133
Plant and equipment 124 106 105 99
Land and buildings 236 234 226 226
2,337 2,534 1,054 1,088
AIRCRAFT, SPARE ENGINES AND SIMULATORS
Cost 2,735 2,682 1,012 1,026
Accumulated depreciation (699) (538) (382) (301)
Carrying value at beginning of the year 2,036 2,144 630 725
Additions 182 137 129 28
Addition from business acquisition 3 - - -
Disposals (102) (2) (39) -
Depreciation (198) (239) (106) (123)
Impairment losses recognised during the year (81) - (14) -
Transfer to assets held for resale (12) (4) - -
Carrying value at end of the year 1,828 2,036 600 630
Represented by:
Cost 2,631 2,735 1,023 1,012
Accumulated depreciation (803) (699) (423) (382)
Carrying value at end of the year 1,828 2,036 600 630
Aircraft, spare engines and simulators comprise:
Finance leased aircraft 835 888 276 289
Owned aircraft, spare engines and simulators 993 1,148 324 341
1,828 2,036 600 630
SPARES
Cost 261 255 217 213
Accumulated depreciation (103) (91) (84) (75)
Carrying value at beginning of year 158 164 133 138
Additions 18 18 12 15
Disposals (9) (8) (8) (7)
Depreciation (18) (16) (14) (13)
Carrying value at end of the year 149 158 123 133
Represented by:
Cost 260 261 219 217
Accumulated depreciation (111) (103) (96) (84)
Carrying value at end of the year 149 158 123 133
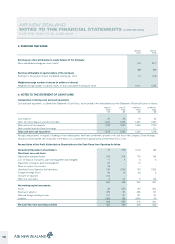
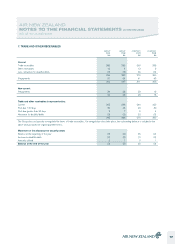
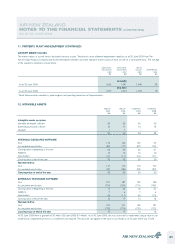
AIR NEW ZEALAND
NOTES TO THE FINANCIAL STATEMENTS (CONTINUED)
AS AT 30 JUNE 2009
19